Engineering Charts
Accessing the Engineering Chart
The engineering chart is accessed from the Data Tree Explorer. There are two access points.

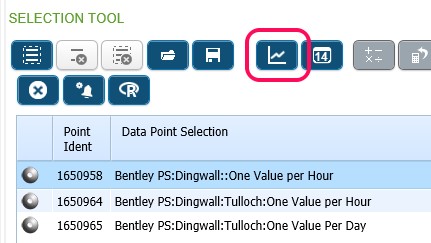
The engineering chart will plot data for single or multiple point selection up to a maximum of twelve.
The following section deals initially with single point selection and demonstrates the available functionality within the engineering chart.
Overview
Select a single point and launch engineering chart. Chart appears in popup window.

- When launched, the engineering chart will interrogate the point’s configuration to determine how much data to display.
- On the point configuration screen, Plot History tab we have the following fields.
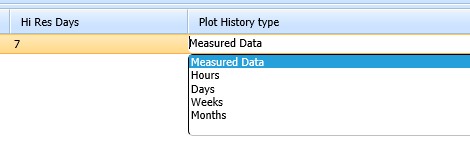
- The ‘Hi Res Days’ tells the chart how many days of data to plot.
- The plot history type tells the chart to plot Measured (raw) data, or averages. The averages can be hourly, daily, weekly or monthly.
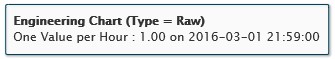
- The engineering chart contains several information fields regarding the current display.
- The ‘Date Range’ fields show the span of the currently loaded data set.


- These are clickable and allow the user to hide/display individual traces.
- A ‘navigator’ trace is situated at the foot of the display.
