Engineering Charts - Summary
Clicking the arrow icon expands the Summary panel.
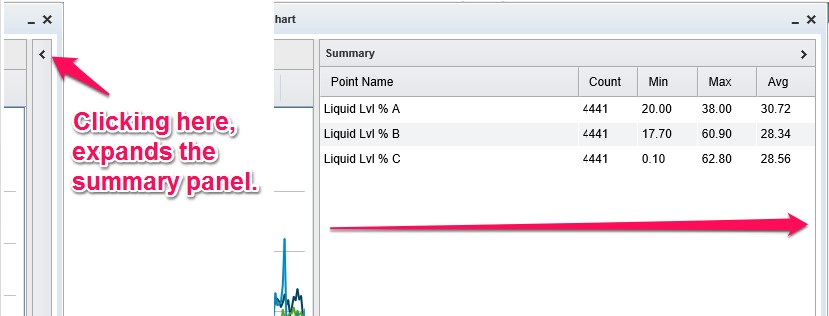
A table is displayed containing Count, Min, Max and Avg values for each of the points on the chart.
The Summary values are updated along with the chart, when changes are made to Graph Type, Resolution, or Date Range and REFRESH is clicked.