P. To display load versus displacement graph
To display the load level versus displacement curve for a selected node and load case, use the following procedure.
-
Select the
Layouts > Node Displacement tool in the
View Results group on the
Results ribbon tab.
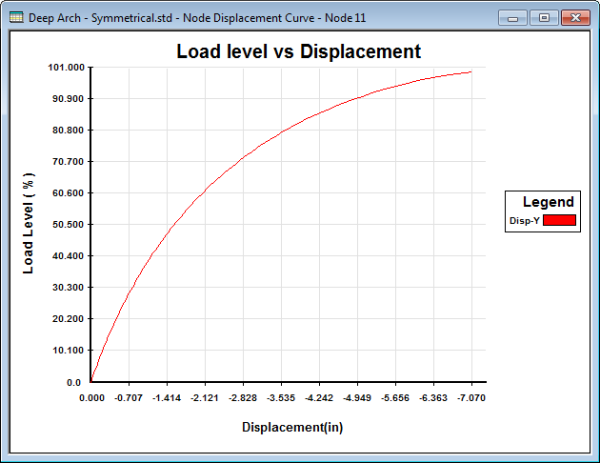
The Node Displacement Curve and Node Displacements table open.
-
Either:
- use the Node Cursor tool in the Cursors group on the Select ribbon tab to select a node in the graphical view
- select a node in the Node Displacements table
The plot for the selected node is displayed. If you select multiple nodes, then the graph will display the plot for the lowest node number. -
Select a
Load in the
View Results group on the
Results ribbon tab.
A nonlinear analysis must be performed for the selected load case.
- Optional:
Specify the
Select Load Step in the
Node Displacements table.
Note: The maximum number of load steps for the current load case is displayed on the right-hand side of the table controls.
- Optional: Check the Limit Maximum Load Step for Graph option in the Node Displacements table to limit the maximum load step displayed in the graph.
-
To change the degree of freedom plotting on the graph:
- Right-click anywhere on the Node Displacements curve window.
-
Select
Geometry from the pop-up menu.
The Diagram dialog opens.
-
Select the displacement degree of freedom you want displayed
on the graph.
You can select multiple degrees of freedom to plot simultaneously.
- Click OK.
The graph and legend update to include the selected curves. - Optional:
To include the current graph in a report:
- Right-click anywhere on the Node Displacements curve window.
-
Select
Take Picture from the pop-up menu.
A Picture # dialog opens to name the image.
- Type an ID and Caption.
- Click OK.
The picture is added to the picture album for inclusion in reports.