P. Finite Element Contour Logic
To aid in the understanding of result values of finite elements, STAAD.Pro provides a number of methods to display the results of plates using a configurable set of options. This section details how the selected options are used to color the structure diagram.
The analysis determines the results of the finite elements at the center of each plate, which are reported in the Plate Centre Stress Table. This is the primary source of the contouring data and is used to determine the colour at the centre of each plate.
The fundamental logic is that the contours are created using values at the center of the plate and at the nodes. The maximum and minimum values of determine the automatic range for which the contours will be generated. The default setting is that equally spaced bands will be defined equally dividing the range into 16 divisions.
The results can either be displayed either:
- as a line, using the
option
Normal Line
In this case, colored lines are drawn on the surface of the plates as contours of equal value. The color of each line represents a contour of a specified value.
- as a color block, using
the options
Normal Fill or
Enhanced Fill
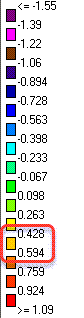
In this case, the colored zone represents an area which has values between two limits given in the legend. For example, in the following legend, a value of 0.5 N/mm will be displayed in light orange as it is within the range of 0.428 and 0.594.
The layout of the contour lines or zones are determined using values either:
- at the center of the plate taken directly from the analysis results, as reported in the Plate Centre Stresses table and
- at the nodes of the plate
which can be determined using either one of two methods. The method used is
specified using the
Index based on Centre Stress option.
- If the option is
unchecked, then the values at the nodes are determined as the average of all
the values of the node results reported in the
Plate Corner Stresses table for all plates
connected at that node.

- If the option is checked, then the value are
calculated using the following formula for each node connected at
the node:
where
- the value at the centre of the plate
- the distance from the center of the plate to the node in question
==
- If the option is
unchecked, then the values at the nodes are determined as the average of all
the values of the node results reported in the
Plate Corner Stresses table for all plates
connected at that node.
Example of How a Contour Plot is Constructed
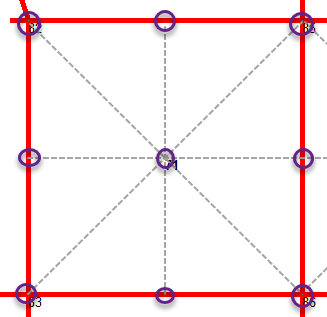
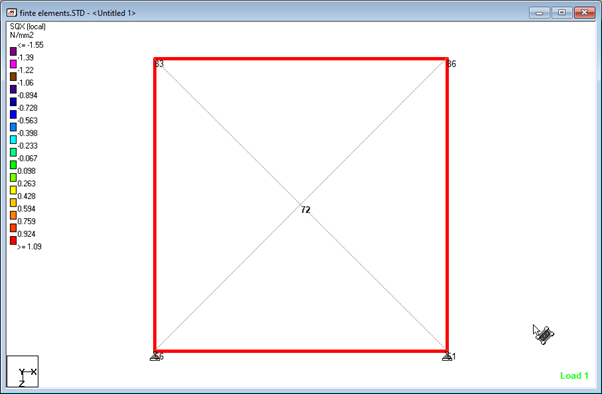
The values at the centre point and each of the nodes are used to construct the contour by defining a slope of results from the center to the nodes, then around the plate between each of the nodes. This creates a number of triangles that are then filled with the contours. Three or four triangles are constructed. A triangular plate will have three and quad plate will have four using the centre node and corner nodes as the vertices.
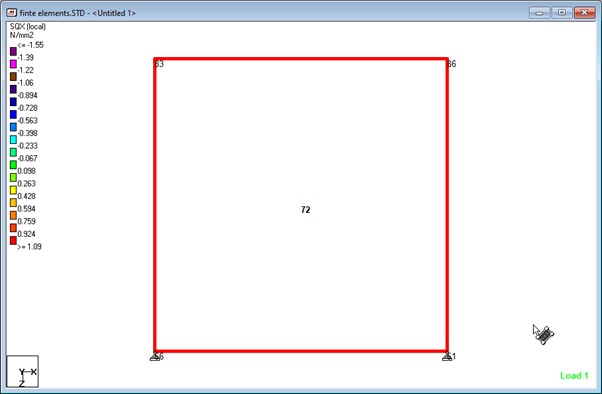
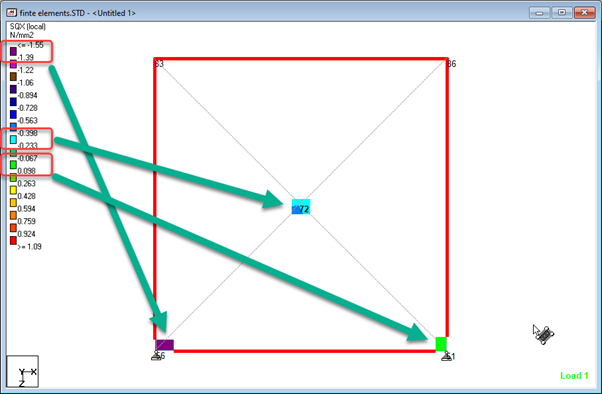
Consider the following quad plate (element number 72), formed from nodes 51, 56, 83, and 86.
For the quad plate example, the four constructed triangles are:
Consider the lower triangle, which is defined by the center point, node 51, and node 56. The stress results for each are:
| Location | Stress (N/mm2) |
|---|---|
| center | -0.39 |
| node 51 | 0.02 |
| node 56 | -1.50 |
This determines the colors (contour level) at each of the triangle vertices.
This establishes the number of contours (i.e., bands) which cross the triangle boundaries (i.e., construction lines). The contours are assumed to be equally spaces (as the contour legend has been equally divided). In the example element, from the center to node 56, there are 7 bands which cross at the following locations.
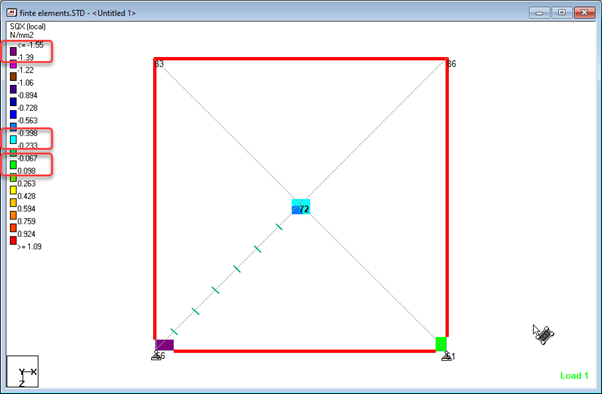
Similarly, from node 56 to node 51 (i.e., the bottom edge of the quad element) there are 10 bands that cross. From node 51 to the center, there are 3 bands that cross.

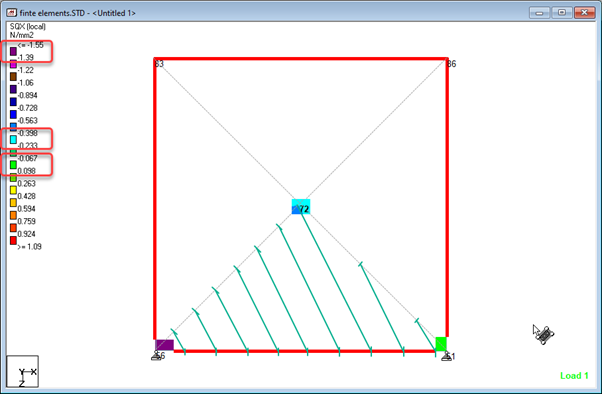
This process is repeated for each of the triangular subdivisions of the element.

The color blocks are defined by the band with a range as per the legend divisions. For example, the turquoise area indicates a zone where the values of SQX are between -0.233 and -0.398 N/mm2.

Enhanced Fill
The enhanced fill option provides a smoothing function in to the contouring that is achieved by subdividing the edges of the plate with and additional contour point. The value at this location is determined as the average between the center stress of the plates that share the boundary.
For example, a quad plate would be divided into 8 triangles.