Schedule Simulation Playback
To view a schedule simulation, select the Schedule Simulation tool from the Task-based Tools zone in the upper right. If you have imported a schedule, the model is displayed at the start of the schedule. Task information for the schedule is displayed in the scheduler pane, and the Gantt chart displays information about the schedule. If you have linked elements to tasks in the schedule, the schedule is ready for schedule simulation playback.
Playing the Schedule Simulation
To play the schedule simulation, select the schedule, then select the play button. You can adjust the speed of playback, by selecting the length of each tick from the Select Playback Speed dropdown. Available options are 1 hour, 4 hours, 1 day, 3 days, 1 week, 2 weeks, 1 month, and 3 months. This is the length of time between each frame of the schedule simulation playback. When you select the Play button, the Gantt Chart marker moves, indicating the current time being displayed. You can also move the Gantt Chart marker manually, by clicking and dragging it. During playback you can pause the schedule simulation, stop the schedule simulation, move to the start of the schedule simulation, or move to the end of the schedule simulation. The state of the model is displayed at the indicated time. Elements in the model display differently while the tasks associated with these elements occur. For more information about types of tasks and the display of elements, go to Importing Schedule Information for Schedule Simulation.
Playback buttons


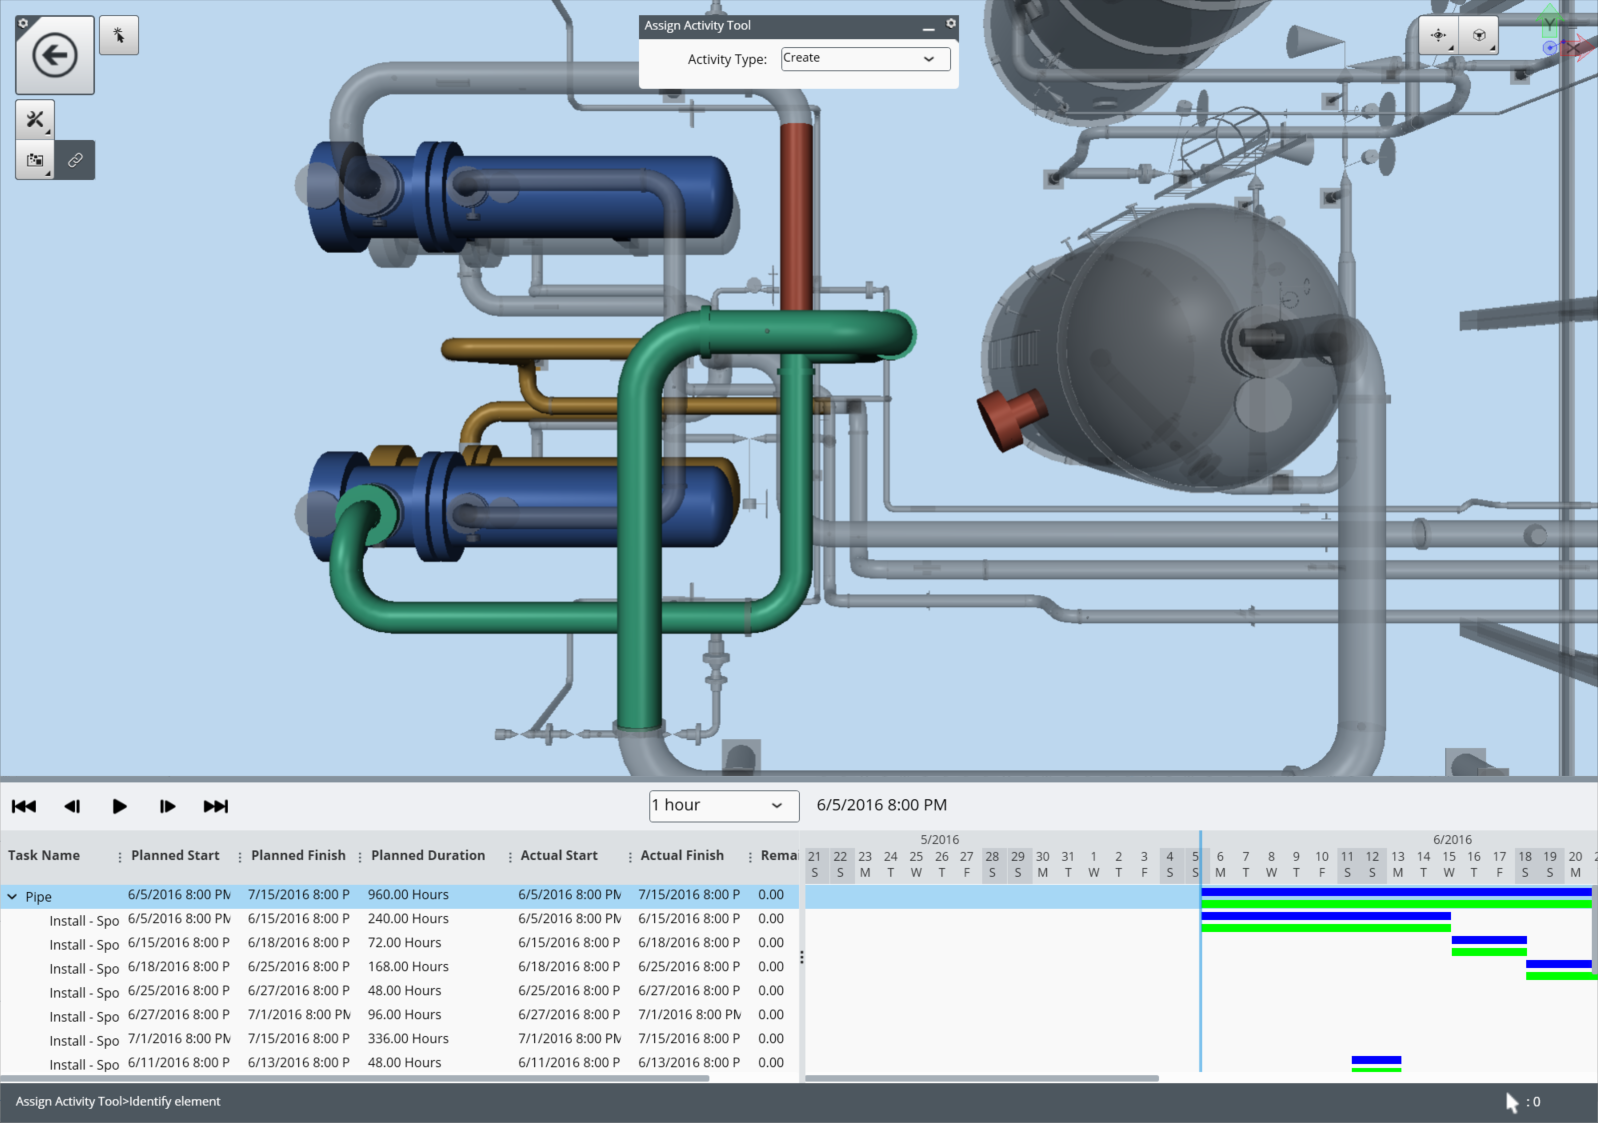
Scheduler Pane
Here you can see a list of the tasks in chronological order. For each task, you can see the Task Name, Planned Start, Planned Finish, Planned Duration, Actual Start, Actual Finish, and Remaining Duration. To see all the tasks, expand the schedule by selecting the > button next to the schedule name and any > buttons within the schedule.
Gantt Chart
The Gantt Chart displays a graphical indication of how long each task will take to complete. Two strips of color are shown corresponding to each task. The blue strip represents the planned duration of the task and the green strip represents the actual duration of the task. The Gantt Chart marker indicates the current time being displayed. The top of the Gantt Chart displays dates. Dates that are part of weekends are shown in gray.