G.17.4.1.3.1 Capacity Spectrum Method
The objective of the Capacity Spectrum Method is to develop appropriate demand and capacity spectra for the structure and to determine their intersection point. During this process, performance of each structural component is also evaluated.
The demand curve is based on the earthquake response spectrum and the capacity curves are based on static, nonlinear pushover analysis. In pushover analysis, the structure is subjected to increasing levels of load, and the base shear versus roof displacement of the structure is charted along the way. The capacity spectrum is obtained by transforming the base shear versus roof displacement spectrum into a spectral acceleration versus spectral displacement spectrum. The intersection of an appropriate demand curve with the capacity curve is called the performance point. The performance point defines the estimated base shear and displacement of the structure when subjected to the earthquake represented by the demand curve. The behavior of the structure at the performance point is compared with predefined acceptance criteria to determine if the design objective is met.
Capacity (Pushover) Curve
The structure capacity is represented by a pushover curve, often termed as capacity curve. This represents the lateral displacement as a function of the force applied to the structure. The most convenient way to plot the force displacement curve is by tracking the base shear and roof displacement.

Roof deflection, Δroof, plotted versus base shear, V
Capacity Spectrum
It is the representation of spectral acceleration vs. spectral displacement derived from the capacity curve. The base shear and the roof displacement are converted to spectral acceleration and spectral displacement respectively by the procedure defined by FEMA to get the capacity spectrum from capacity curve.
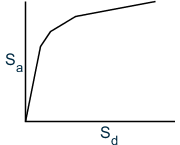
Spectral displacement, Sd plotted versus spectral acceleration, Sa
Conversion of Capacity Curve to Capacity Spectrum
Capacity curve, in terms of base shear and roof displacement, is converted to capacity spectrum, which is a representation of the capacity curve in Acceleration Displacement Response Spectra (ADRS) format (i.e., Sa versus Sd).
The required equations for conversion are the following:
| (1-3-1) |
| (1-3-2) |
| Sa = VW/α1 | (1-3-3) |
| Sd = Δroof/(PF1φroof,l) | (1-3-4) |
| = | ||
| = | ||
| = | ||
| = | ||
| = | ||
| = | ||
| = | ||
| = | ||
| = | ||
| = |
Demand spectrum
This curve is obtained by redrawing the design earthquake response spectra as a curve of spectral acceleration vs spectral displacement.
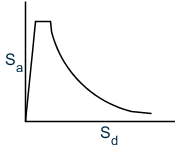
Response spectrum
Performance
Once capacity and demand spectra are defined, a performance check can be one. A performance check verifies that structural and nonstructural components are not damaged beyond the acceptable limits of the performance objective for the forces and displacements implied by the displacement demand.