P. To display mode shapes
To display the mode shape diagram and a table of mode shape data, use the following procedure.
-
Either:
The Mode Shape tool is only active if the current load is a dynamic load case. The mode shape for the currently selected mode and load case is displayed.
on the Results ribbon tab, select the Mode Shape tool in the Dynamics group

or
on the Results ribbon tab, select the tool in the Dynamics group
or
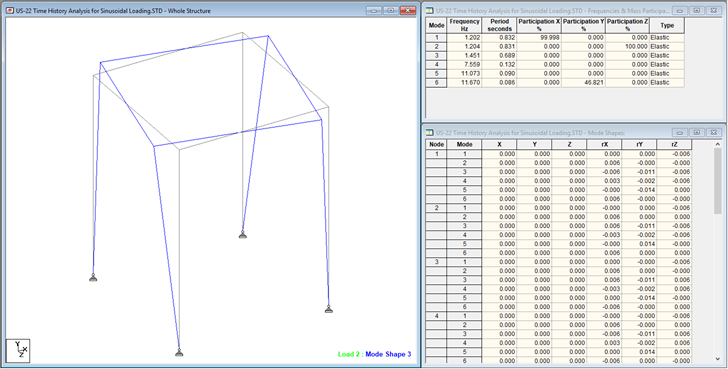
If you selected the Layout or the Page control, the Frequencies & Mass Participation and Mode Shapes tables are also displayed.
- (Optional) Select a different Load in the View Results group on the Results ribbon tab.
- (Optional) Select a different Mode in the Dynamics group on the Results ribbon tab. This option is only active if the current load is a dynamic load case.