Widget Size: 2x1, 2x2, 3x1, 4x1
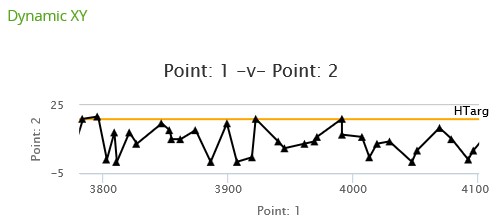
The XY Chart widget is used for displaying XY Plots, as
shown below.
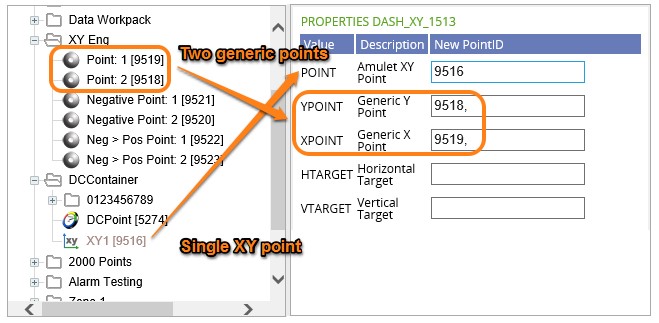
The plots can be made up of a single XY Point or two
generic points (one for the X and one for the Y).
An XY graph is a graph where a point’s values and distance
measurements can be viewed in various days. A difference between the XY plot
and a normal plot is that the XY data is not stored as value against time but
as value against value in addition to a time. The XY plot allows multiple
values of a point to be plotted against a common X-axis at a specific time as
well as viewing the same data at different times. This would be commonly used,
for example, when measuring water/oil through a pipe.
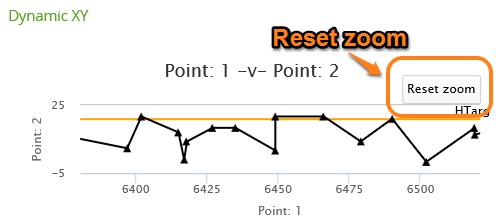
When viewing the live widget, it is possible to drag an area
of the plot to zoom in. When you are zoomed in, click the Reset button to
return to the default level of magnification.
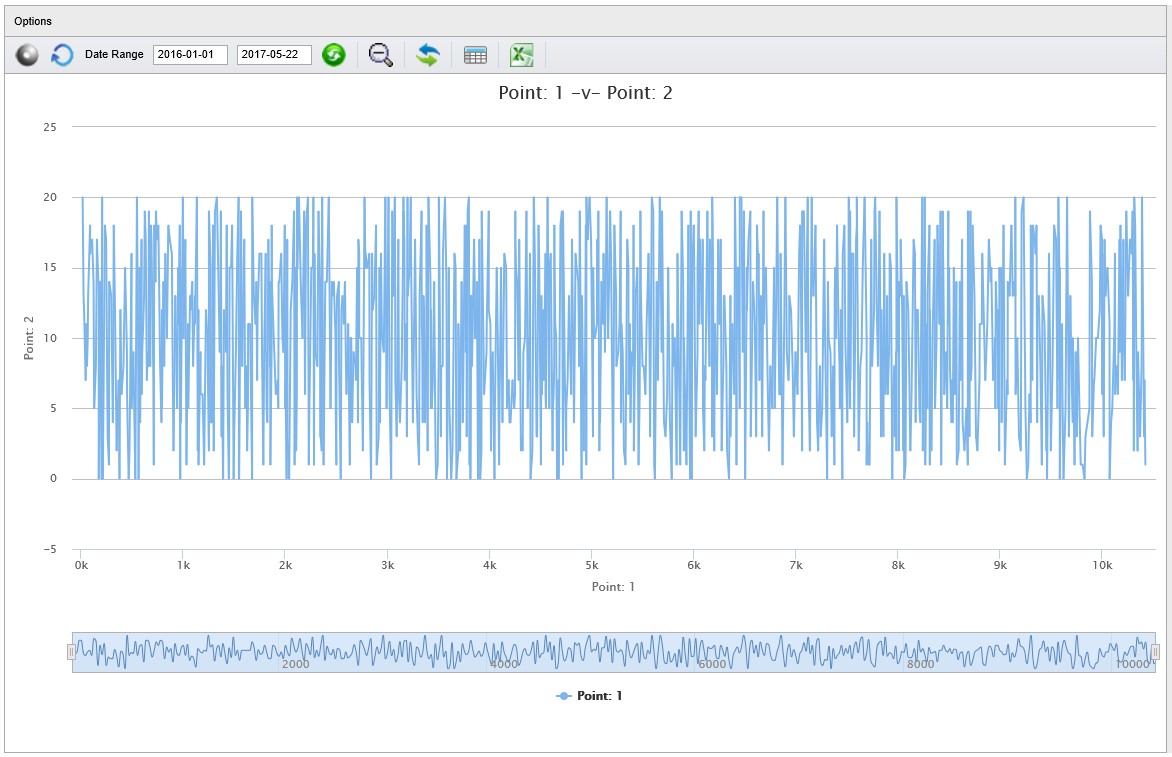
Clicking anywhere on the plot allows a drill-down into the
XY
Engineering Chart.
Customisation
| Value
|
Default
|
Comment
|
| Widget Heading
|
XY Chart
|
Enter the name of the widget
as it is to appear in the heading.
|
| X Axis Label
|
|
Add a customized label to the
X-axis.
|
| Y Axis Label
|
|
Add a customized label to the
Y-axis.
|
| Graph Label
|
|
Edit the name of the graph
label/heading.
|
| Graph Colour
|
Red
|
Change the colour of the
graph itself.
|
| Refresh Period
|
0
|
Select a refresh period from
the drop-down, between 15 sec to 1 hr, or no refresh at all.
|
| Line Type
|
Line
|
Choose between Line, Spline,
or Scatter.
- Line - A plot
that has straight lines between point values/markers.
- Spline - A plot
that is curved between point values/markers.
- Scatter - A
plot that has no lines between point values/markers (i.e., markers only).
|
| Marker Style
|
None
|
Select between Circle,
Square, Triangle, or None. This is the marker that appears on the plot line
when there is a value.
|
| Point Type
|
XY
|
Identify which properties to
use.
- XY - Use the
single point in "Amulet XY Point"
- Generic - Use
the two points in "Generic Y Point" and "Generic X Point".
|
| Y Axis Scaling
|
Linear
|
Select either Linear or
Logarithmic.
- A linear scale
is a means of visually showing the scale.
- A linear
scale can be very simple, a line marked at intervals to show the distance the
scale represents.
- A logarithmic
scale is a nonlinear scale used when there is a large range of quantities.
Common uses include the earthquake strength, sound loudness, light intensity,
and pH of solutions. It is based on orders of magnitude, rather than a standard
linear scale, so each mark on the scale is the previous mark multiplied by a
value.
|
| Horizontal Target Label
|
|
Add a customized label to the
Horizontal Target line.
|
| Vertical Target Label
|
|
Add a customized label to the
Vertical Target line.
|
Properties
- Amulet XY Point – Enter
the ID of the XY point.
- Generic Y Point – Enter
the ID of the Y element of the generic XY plot.
- Generic X Point – Enter
the ID of the X element of the generic XY plot.
- Horizontal Target – Enter
the ID of a point whose last value will be used as a horizontal target line on
the chart.
- Vertical Target – Enter
the ID of a point whose last value will be used as a vertical target line on
the chart.