XY Engineering Charts
The new XY chart is similar to the existing engineering chart; however, it differs in that it does not display data as a time series. The new chart accepts a selection of two independent points and matches data from both points using timetag and then displays an XY plot with the first point on the X-axis and the second on the Y-axis.
Accessing the XY Chart
The XY chart is accessed from the Data Tree Explorer. A function button has been added to the selection tool.
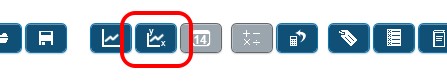
The XY chart button is only available when two (and only two) points are selected.
XY Chart
When you select two points and launch the XY chart, the chart appears in pop-up window.
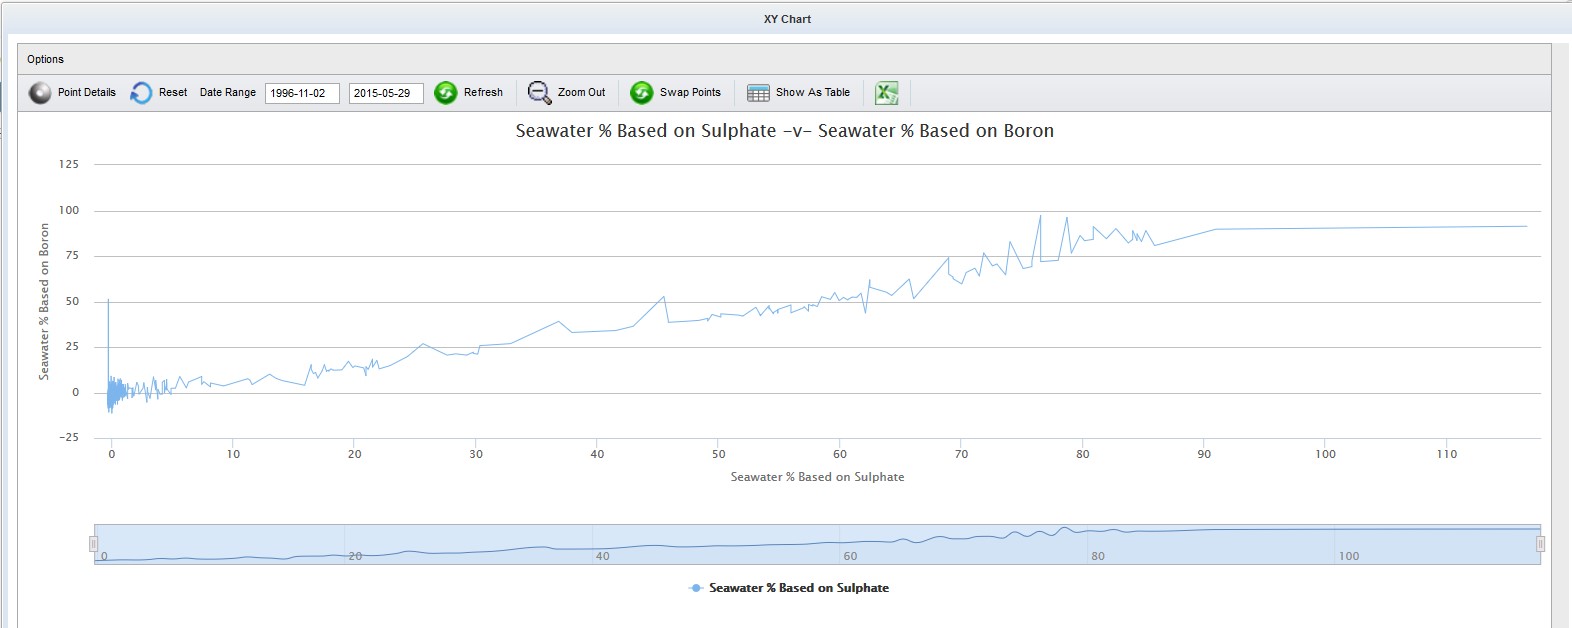
By default, the XY chart interrogates the data for both points and loads all of the data where timetags match.
Options Menu
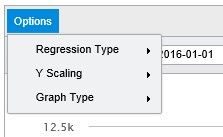
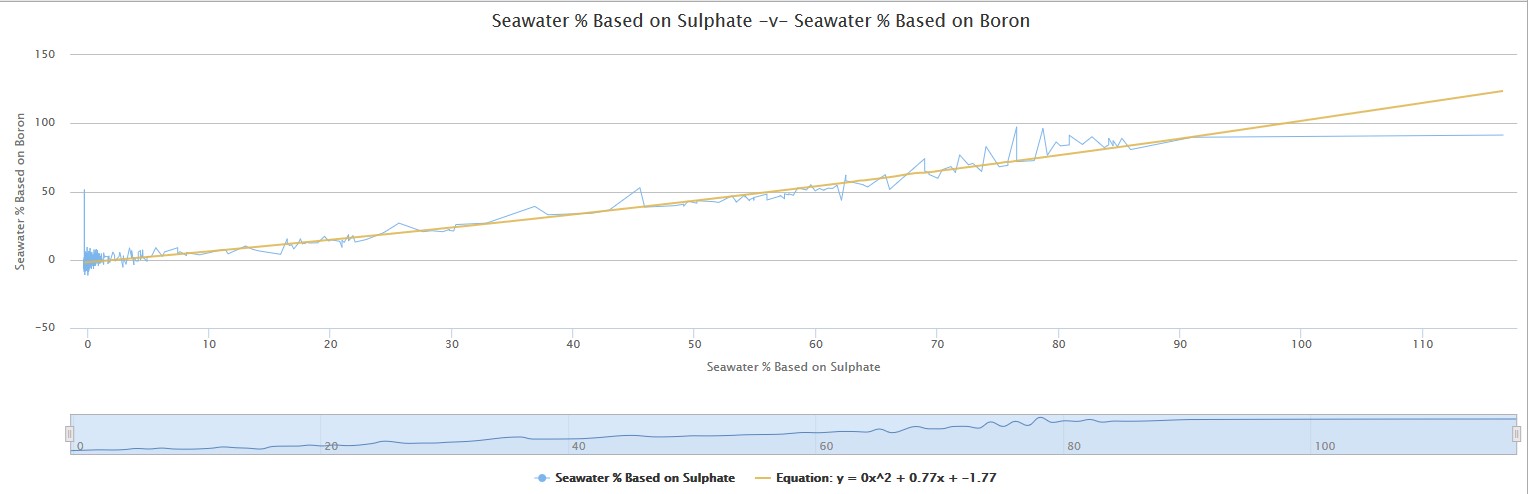
- Regression Type – None is the default option, but you can select Linear or Polynomial.
- Y Scaling – This allows
the user to toggle the y-axis scaling between linear and logarithmic. A linear
scale can be very simple, a line marked at intervals to show the distance the
scale represents.
- A logarithmic scale is a nonlinear scale used when there is a large range of quantities. Common uses include the earthquake strength, sound loudness, light intensity, and pH of solutions. It is based on orders of magnitude rather than a standard linear scale, so each mark on the scale is the previous mark multiplied by a value.
- Graph Type – Choose between Line, Spline, or Scatter.
Toolbar Functions

- Point Details: This is a display-only function that displays a pop-up with point names, idents, and units.
- Date Range: By default, this shows the timespan of the displayed data on launch. To adjust, alter the date range then click the Refresh button.
- Reset Button: Click to return the dialog to the default values.
- Zoom Out: The chart provides zooming functionality. The user can zoom in on a selected area by dragging an area on the chart or by using the navigator at the foot of the window. This button provides a quick method of resetting the zoom.
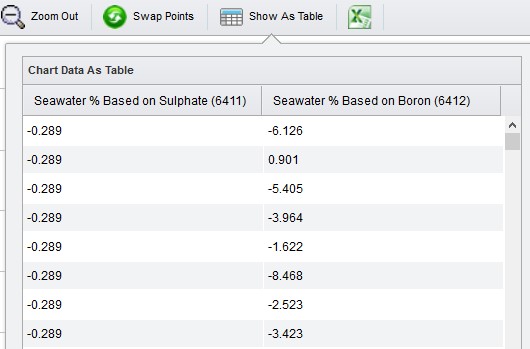
- Swap Points: This function allows the user to toggle the placement of the points on the axes. Clicking will move the point currently on the x-axis to the y-axis and vice versa.
- Show As Table: Click to open a pop-up that displays all of the chart’s data in tabular format.
- Export To Excel: Click to export the chart data to a CSV file so that it can be displayed in Microsoft Excel.


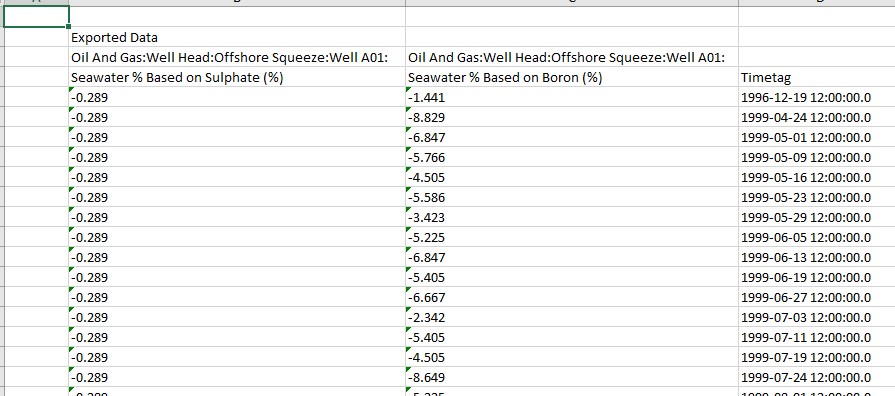
The exported file shows the full paths and names of the two points, each of the data rows, and the corresponding, common timetag.
The XY Chart also supports Episodes if they have been configured in Episode Administration.
Episodes are displayed by selecting from the drop-down on the top menu bar.

The chart will then update to show only the data for the period of the selected episode.