Selection Tool
The Selection Tool on the right hand side is where we can build up a group of points for various configuration or viewing options. This is just a view. If a point is removed from here, then it will still exist in the tree view. If users regularly work with the same sets of points, the selection group can be saved and reloaded. The maximum number of points allowed in the Selection Tool is 2000, though each function that comes from the Data Tree Explorer has its own individual limits. Currently only Attributes can handle a selection of 2000 points.
Selection Tool Icons

Click the Move Point Up/Move Point Down icons to re-order points within the grid. If the grid contents are saved to a selection set, then the order is maintained on the save/load.

Select All, Remove Selected, Remove All – this allows the user to select all items in the selection tool and either remove the selected items or remove all. The select all icon will select items ready to be used by another function.

Select All – this will select all the items in the selection tool. Users can also select items by holding the shift or ctrl keys and mouse clicking on each point.

Remove Selected – this will remove the selected/highlighted items from the selection tool.

Remove All – this will remove all items from the selection tool whether they are selected or not.

Use Saved Selection – this will allow the user to open a previously saved selection file.

Save This Selection – users can save the points in the selection file ready to be re-used again. This option allows the user to save the selection with a meaningful name. This saves the user from going through the tree and sending to selection when working with a regular set of points.

Engineering Chart – this will open a chart using the selected/highlighted points.

Calendar Chart – this will open a chart using the selected/highlighted points.

Calculation Designer – this will open the calculation designer. The user must have a calculation point selected.

Calculator Executor – this will open the calculator executor. The user must have calculation point(s) selected.

Attributes – this will open the attribute window which will allow users to add, edit and delete attributes for the selected/highlighted points

Bulk Attributes – this will allow the user to assign the same attribute to multiple points at the same time.

Data Workbook – this will open the data workbook. The data workbook allows the user to view and save data values for the selected/highlighted points

Export to Excel – this will allow the user to export data for the selected/highlighted points. The user can choose the date range they are wanting.

Configure Point – this will open up the point configuration for the selected/highlighted points. This allows the user to edit settings such as point name, description, units.

Alarm Config – this allows the user to configure the standard alarms for the selected/highlighted points. There is a choice of 5 alarms – Low Fault, Low Alert, High Fault, High Alarm and High Alert.

Data Delete – this allows the user to delete data values for the selected/highlighted points. The user can enter the date range they are deleting data for.
Saving and Restoring Favourite Selections
Functionality is provided to allow you to save and re-use frequently used point selections that can be opened and automatically update with the latest data values, instead of going into the tree and selecting all points manually
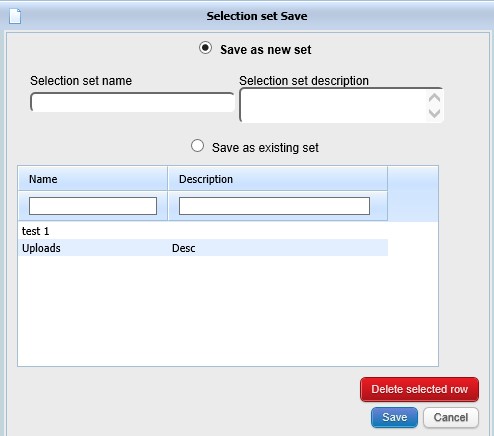
- When the points you require are in the grid, press the Save This Selection button.
- In the new window, name the selection file and add a description.
- Alternatively, previously saved files can be overwritten. Previously saved files can also be selected and deleted.
- Press the Save button to store the selection.
- To open a previously stored file, press the Use Saved Selection icon and select the file from the list.
Plotting a Chart
Points within the Selection Tool can have certain actions performed on them, such as creating charts.
Select the points to display and press one of the chart buttons to create the graph.

- Engineering Chart – This will display a single or multiple points on a single chart. See separate Engineering Charts help guide for further details.

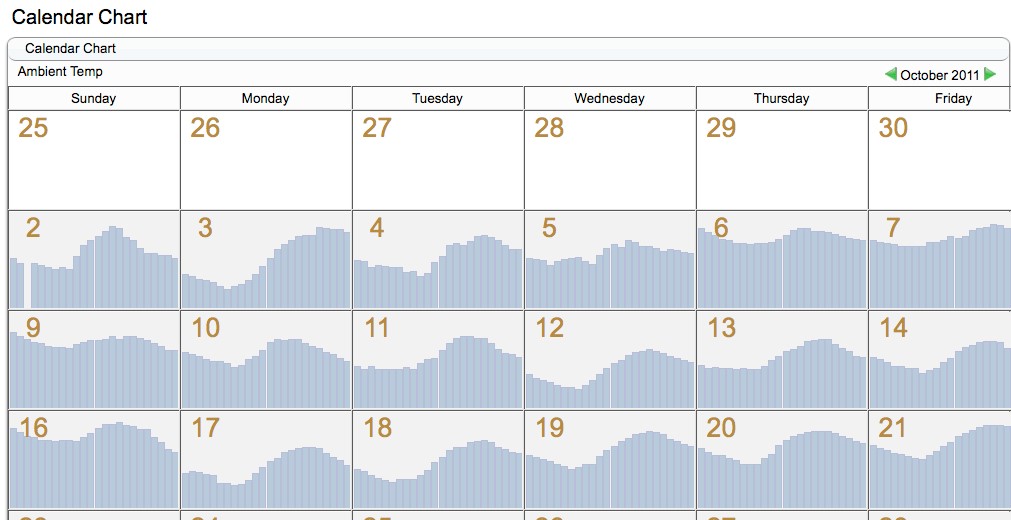
- Calendar chart – This will display a calendar view for one point only. Clicking on an individual bar within the calendar chart will take you to an Engineering Chart for that point.
Data Delete
Should your database become too large or some data needs to be removed, it is possible to delete data using this function. This process only deletes the values and not the points themselves.
Select the point (multiple points can be selected like a bulk action) to be deleted from the Selection window and press the Data Delete button.
- This will bring up the Data Delete options.
- Select the dates that you wish to delete from using the Start and End dates and times.
- Press the Confirm button to start the cancel. This will prompt the user with a warning message. Press OK to continue.
- A Summary screen will appear confirming the success.
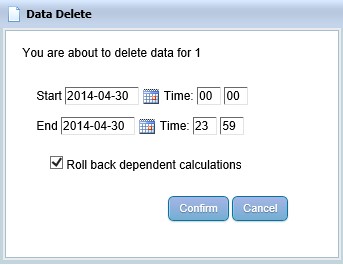
With the Rollback Dependant Calculations option unchecked, it will simply delete the data, and any calculations that were dependant on the point will stay the same.
If the option was checked, then the data would be deleted and any dependent calculations will be affected when rerun. E.g., A+B=C – if some data from A is deleted, then the C calculation will have a different answer as it was dependant on the values in A. This applies to any nested calculations which uses the deleted data from the point.