Estimation Process
This chapter discusses the estimation process in the CUBE Analyst application. Topics include:
This section discusses a highways based application of CUBE Analyst for an 82-zone study area for the town of Guildford in Surrey, UK, (pop. 100,000). The network shown has a major bypass for the town, which is shown as a thicker line. Zone centroid connectors are shown as pale blue lines. Eleven zones were designated cordon-crossing zones at the study area boundary.
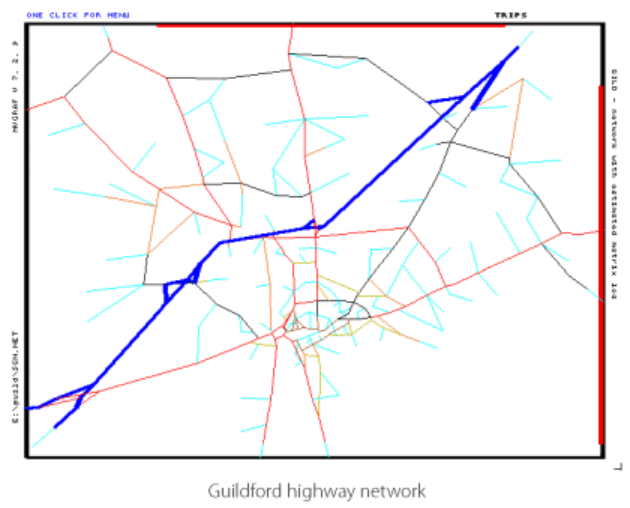
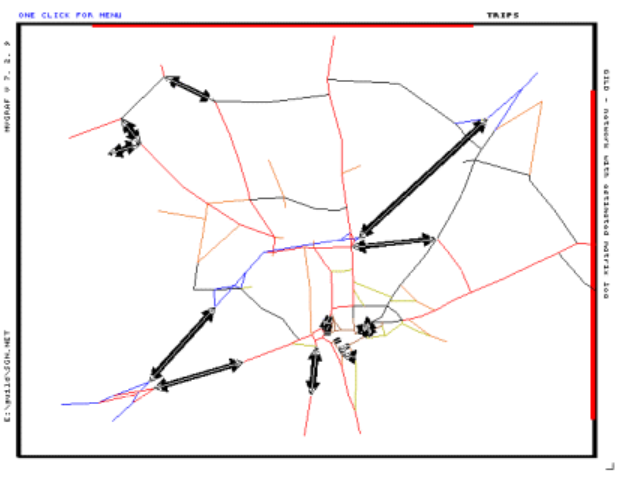
The network was well provided by current traffic counts and these were all given a confidence level of 80, which served as a benchmark for other data confidences. Most of the trip end data was synthesized, by disaggregation of UK Department of Transport data with reference to zonal population and employment figures, and was given confidence levels of 40. Higher confidence values of 80 were set for external trip ends, determined from a cordon crossing survey, and to a set of five zones in the town center area that were the subject of a car park survey. An out-of-date trip matrix existed, which served as the prior matrix, and which was given a uniformly low confidence for each cell of 5. Sixteen screenlines were defined, which are shown in the following figure.
MVHWAY in TRIPS was used to calculate three sets of Burrell paths. The degree of randomization was controlled by setting the SPREAD parameter to 25, a relatively low value selected after viewing paths for different values using MVGRAF and using local knowledge of the network. MVHWAY was also used to prepare a cost matrix based on minimum cost routes.
CUBE Analyst offers a number of controls on the calculation process and convergence criteria, but these were left to take default values and the process of running CUBE Analyst itself was entirely straightforward. However, a series of estimation runs were undertaken, as described below.
The results provided by CUBE Analyst of the first estimation are shown. These show extracts of the CUBE Analyst printed reports, from which a number of observations can be made.
Because each data item enters the objective function, the number of elements associated with each different type of data is significant, as well as their confidence levels.
Confidence and convergence summary

  AVERAGE CONFIDENCE LEVELS (EXCLUDING ZERO VALUES)
                              Average  Maximum  Minimum Number of
                                                        Elements
Trip matrix confidence levels       5.0      5.0      5.0   6724
Screen line confidence levels      80.0     80.0     80.0     16
Trip end (dest) confidence levels  47.8     80.0     40.0     82
Trip end (orig) confidence levels  47.8     80.0     40.0     82
Optimisation halted because:
Convergence detected
The optimizer adjusts model parameter values and evaluates the resulting cell estimations in a series of iterations. The mathematics of the optimizer implies that it will converge to a solution in a number of iterations which is less than the number of model parameters.
Trip end comparison of prior (observed) and estimated values

MVESTM with Counts, Input Prior Matrix and Trip Ends Only


REPORTING OBSERVED/ESTIMATED GENERATIONS AND ATTRACTIONS


               GENERATIONS                   ATTRACTIONS

ZONE NO    OBS.     EST. OBS-EST       %     OBS.     EST. OBS-EST    %

1    4869.0   4324.3   544.7   11.2%   3657.0   3591.6    65.4   1.8

2    3825.0   3745.0    80.0    2.1%   2984.0   3571.1  -587.1 -19.7

3    1798.0   2559.5  -761.5  -42.4%   5715.0   5710.1     4.9   0.1

4     419.0    383.2    35.8    8.5%    558.0    528.3    29.7   5.3

5    1256.0   1572.5  -316.5  -25.2%   2018.0   2156.1  -138.1  -6.8

6    2045.0   1731.1   313.9   15.4%   2084.0   1998.6    85.4   4.1

7    1935.0   1815.4   119.6    6.2%   2112.0   2194.3   -82.3  -3.9

8    1794.0   1894.8  -100.8   -5.6%   2673.0   2815.2  -142.2  -5.3

9    3662.0   3364.9   297.1    8.1%   4763.0   4247.7   515.3  10.8

10     430.0    388.9    41.1    9.5%    273.0    307.1   -34.1 -12.5

Some missing....

30    3870.0   3176.5   693.5   17.9%   2370.0   2375.0    -5.0  -0.2

31    2778.0   2618.2   159.8    5.8%   1304.0   1616.1  -312.1 -23.9

32    5450.0   4633.8   816.2   15.0%   3257.0   3175.7    81.3   2.5

33    2943.0   2741.1   201.9    6.9%   3006.0   2807.4   198.6   6.6

34     736.0    806.5   -70.5   -9.6%   1151.0   1107.2    43.8   3.8

35     368.0    785.9  -417.9 -113.5%    930.0    909.7    20.3   2.2

36    4042.0   4062.2   -20.2   -0.5%   1523.0   1570.5   -47.5  -3.1

37    1821.0   1964.4  -143.4   -7.9%   2026.0   2083.9   -57.9  -2.9

38    4719.0   4763.3   -44.3   -0.9%   2683.0   2326.7   356.3  13.3

39    3116.0   3440.8  -324.8  -10.4%   6410.0   6234.9   175.1   2.7

40    3030.0   3369.2  -339.2  -11.2%   5227.0   6016.3  -789.3 -15.1

Some missing....

70    1829.0   1639.9   189.1   10.3%   1251.0   1214.6    36.4   2.9

71    1089.0   1160.4   -71.4   -6.6%   1298.0   1364.2   -66.2  -5.1

72    4396.0   4122.0   274.0    6.2%   4226.0   3952.8   273.2   6.5

73   10600.0  11231.3  -631.3   -6.0%  11100.0  11146.4   -46.4  -0.4

74    6950.0   6931.0    19.0    0.3%   5806.0   5720.2    85.8   1.5

75    9200.0   9605.6  -405.6   -4.4%   9200.0   9384.8  -184.8  -2.0

76   14423.0  15045.9  -622.9   -4.3%  14313.0  14109.6   203.4   1.4

77    1008.0    824.4   183.6   18.2%    722.0    655.4    66.6   9.2

78    2270.0   2217.8    52.2    2.3%   2270.0   2236.2    33.8   1.5

79    5665.0   5396.6   268.4    4.7%   5665.0   5465.7   199.3   3.5

80   26660.0  26727.9   -67.9   -0.3%  28912.0  27872.0  1040.0   3.6

81    5310.0   5258.3    51.7    1.0%   5990.0   5940.6    49.4   0.8

82    6033.0   6390.8  -357.8   -5.9%   6085.0   6601.1  -516.1  -8.5
CUBE Analyst prints basic comparisons of input and estimated data for:
- Trip ends (Trip end comparison of prior (observed) and estimated values)
- Screenline inputs (Screenline comparison of prior (observed) and estimated values)
This information must be interpreted with care, as a difference may be a good feature, indicating that some other, more reliable information has determined the estimated result.
Screenline comparison of prior (observed) and estimated values

MVESTM with Counts, Input Prior Matrix and Trip Ends Only

    REPORTING OBSERVED/ESTIMATED SCREEN LINE COUNTS

SCRLINE NO    OBSERVED   ESTIMATED     OBS-ESTM        %

       1     11677.0     11301.1        375.9     3.2%

       2     11677.0     11925.8       -248.8    -2.1%

      3     27947.0     26234.4       1712.6     6.1%

      4     25504.0     25213.3        290.7     1.1%

       5     28539.0     31075.9      -2536.9    -8.9%

       6     28431.0     30261.4      -1830.4    -6.4%

       7     18981.0     15441.2       3539.8    18.6%

       8     18809.0     18445.5        363.5     1.9%

       9     24000.0     23770.1        229.9     1.0%

      10     24435.0     23585.0        850.0     3.5%

      11      7225.0      7635.8       -410.8    -5.7%

      12      7225.0      8479.7      -1254.7   -17.4%

      13     16285.0     16367.7        -82.7    -0.5%

      14     22670.0     23883.7      -1213.7    -5.4%

      15      6261.0      6511.4       -250.4    -4.0%

     16      6022.0      6886.0       -864.0   -14.3%
Evaluation: Sensitivity analysis
The estimated matrix was also evaluated by examining how sensitive the results were to changes in the input data:
•Alterations in confidence levels — The effect of assumptions in setting confidence levels was tested by increasing the confidence levels from 80 to 200 on two screenlines for the major traffic carrying road (the town bypass).
Using the previously calculated model parameter and gradient search (Hessian) matrix, the re-estimation, in this case, required only six iterations. The differences between observed and estimated screenline counts were correspondingly improved.
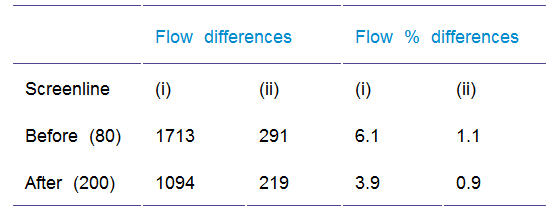
Elsewhere, other screenlines were marginally affected, both better and worse, apart from one screenline where the improvement was much more noticeable.
In general, the results suggested that small changes in confidence levels were not significant, but that improvements were obtainable where it was possible to refine values of confidence levels rationally.
Matches of estimated and input data can always be improved for individual data items by increasing the corresponding confidence, but this will only have a net improvement on the estimated matrix when it does not exacerbate data inconsistencies.
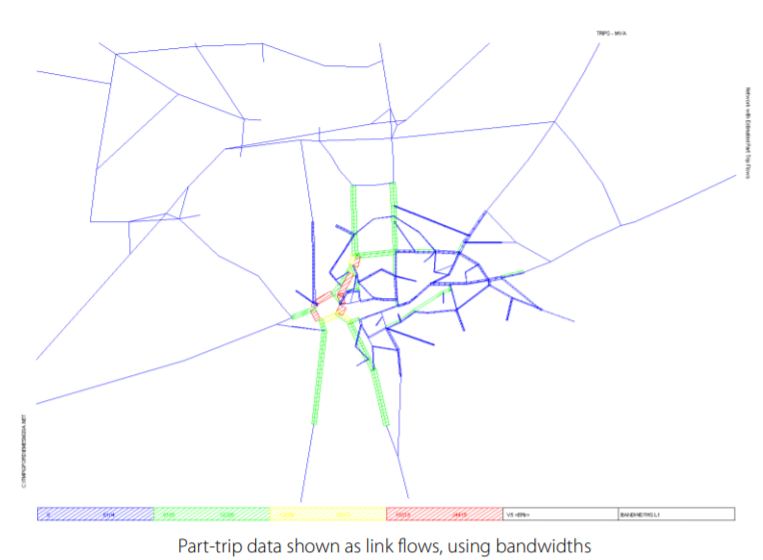
The original estimation of the Guildford matrix was later updated using a set of data which corresponded to a license plate match survey taken around the center of the town. The data was preprocessed and converted into a set of link flows, as illustrated in terms of bandwidths; this also serves to indicate the extent of the survey.
The estimation was re-run, now incorporating the following sets of information:
•Prior matrix
•Trip ends
•Link counts
•Part-trip data
The figure Part-trip data and link counts shows the two sets of link flow information which were used. Link counts, shown as open bandwidths, and part trip, as shown previously in the figure Part-trip data shown as link flows, using bandwidths on page 97. It may be noted that some links had both link count data and part trip data. In this application, the confidence levels for link counts were set higher, at 80 or more, than those for part-trip data, which were set at 60 in recognition of the sampling process inherent in license plate surveys.

Extracts of the CUBE Analyst results of new estimation are shown in Results of estimation—including part trip data and Results of estimation—including part trip data. These are similar to those presented in Estimating the matrix, but with additional information concerning part-trip data, and with some differences of presentation format. From Results of estimation—including part trip data, it may be noted that the estimated part-trip flows match the overall number of observed part trips, in this case, to within 1.9%. This, of course, partly reflects their relatively high confidence levels and number of elements, which are reported near the top in Results of estimation—including part trip data. Number of elements for part-trip data is the number of (one-way) links with part-trip data. The figures, Part-trip data shown as link flows, using bandwidths on page 97 and Part-trip data and link counts on page 98, in fact, show respectively estimated and observed part-trip data, but the difference is too small to make clear graphically in this particular application. It is therefore useful to view the correspondence as a tabulation. This report is shown in Report on observed and estimated part trip data, which is headed by a key explaining the storage of information in volume fields.
Results of estimation—including part trip data

AVERAGE CONFIDENCE LEVELS (EXCLUDING ZERO VALUES)

-------------------------------------------------


                               Average  Maximum  Minimum  Number of


Trip matrix confidence levels              5.0      5.0      5.0     6642

Screen line confidence levels             95.0    200.0     80.0       16

Trip end (dest) confidence levels         47.8     80.0     40.0       82

Trip end (orig) confidence levels         47.8     80.0     40.0       82

Part Trip confidence levels               60.0     60.0     60.0      226


SUMMARY OF FINAL FIVE ITERATIONS

--------------------------------


Iteration        Stepsize              Objective        Matrix

         (Tolerance=0.00010)          Value          Total

 34           0.0003559             -8859208.83         229655.8

 35           0.0001208             -8859208.83         229656.0

 36           0.0001890             -8859208.83         229655.9

 37           0.0001123             -8859208.83         229655.9

 38           0.0000580             -8859208.83         229655.9


Optimisation halted after   38 iterations because:

Convergence detected
Results of estimation—including part trip data

REPORTING PRIOR/ESTIMATED MATRIX TOTALS

     CONFIDENCE     PRIOR   ESTIMATED  ESTM-PRIOR  (ESTM-PRIOR)/PRIOR(%)

    5.0  238498.0    229655.9     -8842.1         -3.7%

 REPORTING OBSERVED/ESTIMATED PART TRIP FLOW TOTALS

 CONFIDENCE     OBSERVED    ESTIMATED   ESTM-OBSV   (ESTM-OBSV)/OBSV(%)

60.0     972944.0     991158.2     18214.2          1.9%

 REPORTING OBSERVED/ESTIMATED GENERATIONS AND ATTRACTIONS

                   GENERATIONS

ZONE NO  CONFIDENCE  OBSERVED  ESTIMATED  ESTM-OBSV  (ESTM-OBSV)/OBSV(%)

1        40.0    4869.0     4714.7     -154.3        -3.2%

2        40.0    3825.0     3756.0      -69.0        -1.8%

3        40.0    1798.0     2015.2      217.2        12.1%

4        40.0     419.0      398.8      -20.2        -4.8%

5        40.0    1256.0     1381.2      125.2        10.0%

6        40.0    2045.0     1879.7     -165.3        -8.1%

7        40.0    1935.0     1866.6      -68.4        -3.5%

8        40.0    1794.0     1786.8       -7.2        -0.4%

9        40.0    3662.0     3490.7     -171.3        -4.7%

10        40.0     430.0      411.9      -18.1        -4.2%

Some missing....

                           ATTRACTIONS

ZONE NO  CONFIDENCE  OBSERVED  ESTIMATED  ESTM-OBSV  (ESTM-OBSV)/OBSV(%)

1        40.0    3657.0     3661.8        4.8         0.1%

2        40.0    2984.0     3142.7      158.7         5.3%

3        40.0    5715.0     5668.6      -46.4        -0.8%

4        40.0     558.0      535.7      -22.3        -4.0%

5        40.0    2018.0     2067.6       49.6         2.5%

6        40.0    2084.0     2000.6      -83.4        -4.0%

7        40.0    2112.0     2092.6      -19.4        -0.9%

8        40.0    2673.0     2629.0      -44.0        -1.6%

9        40.0    4763.0     4437.3     -325.7        -6.8%

10        40.0     273.0      279.5        6.5         2.4%

Some missing....


REPORTING OBSERVED/ESTIMATED SCREEN LINE COUNTS

SCREENLINE CONFIDENCE  OBSERVED  ESTIMATED  ESTM-OBSV   OBSV(%) NO OF ODs

NO & NAME

1  A'shot Rd W-E

         80.0   11677.0    11370.7     -306.3     -2.6%       219

2  A'shot Rd E-W

         80.0   11677.0    11651.1      -25.9     -0.2%       221

3  A3-Hogs Back S-N

        200.0   27947.0    26670.6    -1276.4     -4.6%       153

4  A3-Hogs Back N-S

        200.0   25504.0    24896.4     -607.6     -2.4%       154

5  A3-Parkway W-E

         80.0   28539.0    29956.5     1417.5      5.0%       538

Some missing....
Report on observed and estimated part trip data

NETWORK IDENTIFIER <Network with Estimated Part Trip Flows>

VOLUME FIELD  1 NAME <Obsv> - Observed Link Counts

VOLUME FIELD  2 NAME <Conf> - Confidences Levels for Link Counts

VOLUME FIELD  3 NAME <PrtT> - Observed Part Trip Data

VOLUME FIELD  4 NAME <PrtC> - Confidence Levels for Part Trip Data

VOLUME FIELD  5 NAME <EPtr> - Estimated Part Trip Data

    Print Comparisons of Part Trip Data and Estimates

REPORT 4:                                           LINK VOLUME FIELDS

ANODE                   2119

BNODE                   2105       2112       2644

-----             ---------- ---------- ----------

1 <Obsv> 8552. 18809. 0.

2 <Conf> 80. 80. 0.

3 <PrtT> 6871. 17775. 9073.

4 <PrtC> 60. 60. 60.

5 <EPtr> 7139. 18420. 10808.

REPORT 4:                                           LINK VOLUME FIELDS

 ANODE                   2120

BNODE                   2127       2207       2212

-----             ---------- ---------- ----------

1 <Obsv> 0. 5387. 0.

2 <Conf> 0. 80. 0.

3 <PrtT> 4906. 3497. 2821.

4 <PrtC> 60. 60. 60.

5 <EPtr> 4565. 3356. 2822.

ANODE                   2843

BNODE                   2113       2194       2841

-----             ---------- ---------- ----------

1 <Obsv> 1226. 0. 0.

2 <Conf> 80. 0. 0.

3 <PrtT> 3635. 213. 0.

4 <PrtC> 60. 60. 60.

5 <EPtr> 3325. 231. 0.