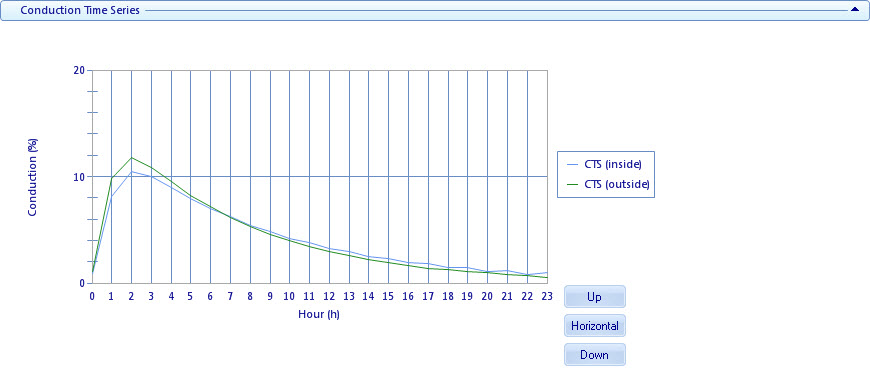
Used to review conduction time series (CTS) values for
selected constructions. The interactive CTS graph displays the values when the
pointer is positioned over the plotted points.
Conduction time series is a series of conduction time
factors for a construction over a 24 hour period. AECOsim Energy Simulator derives construction CTS graphs based upon
the thermal properties of each material type that makes up the construction.
Heat gains from exterior surfaces is affected by the rate
of conductive heat transfer through them. In order to determine this rate, AECOsim Energy Simulator uses conduction time series (CTS) values.
Each exterior construction has 24 different CTS percentage values, summing to
100%, that indicate how much of the heat stored in the envelope has come
through after a given amount of time.
| Setting | Description |
|---|
| CTS Graph
|
CTS graph values are derived through a complicated
process that examines the material properties that make up each construction.
For the purposes of cooling, the U-value of a construction is also used (for
heating, only the U-value is used and not CTS values). The weight of a
construction (also derived from material properties) also plays a role in
determining the thermal storage characteristics of a space.
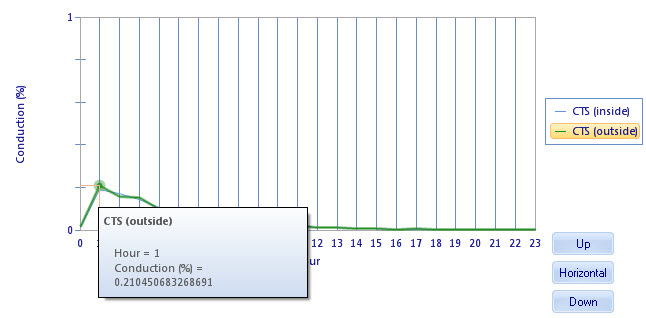
- Pop up CTS data —
To view CTS data, position the pointer over one of the plotted points on the
CTS graph. A pop up dialog appears displaying the data. Also, when a data point
is displayed, two perpendicular reference extension lines are drawn on the
graph from the point to the Hour and Conduction (%) axes.
- Inside/Outside
– Displays which graph type the selected point belongs to.
- Hour – Displays
the hour for the selected point's data.
- Conduction (%)
– Displays the conduction time series percentage for the selected time period.
- Legend — The CTS
graph legend display highlights when a plotted point is selected. I You can
also click the legend item to highlight the corresponding CTS graph.
|
| Up
|
Used to update the CTS graph with upward flow heat
transfer data.
|
| Horizontal
|
Used to update the CTS graph with horizontal flow
heat transfer data.
|
| Down
|
Used to update the CTS graph with downward flow heat
transfer data.
|