Unit Discharge, qu (csm/in.)
The unit discharge (qu) for the watershed is computed and printed into this field. Graphs depicting the relationship between time of concentration (Tc), Ia/P, and qu (csm) are displayed in Exhibit 4-I, 4-IA, 4-II, and 4-III in TR-55, Urban Hydrology for Small Watersheds (U.S. Soil Conservation Service 1986b). These graphs are described in the equation below from Appendix F, in TR-55, Urban Hydrology for Small Watersheds (U.S. Soil Conservation Service 1986b).
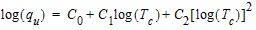
| qu | = | Unit peak discharge (csm/in) | |
| Tc | = | Time of concentration (hr.) (minimum T c = 0.10 hr., maximum T c = 10.0 hr.) | |
| C0, C1, C2 | = | Coefficients from Table F-1 in TR-55, Urban Hydrology for Small Watersheds (U.S. Soil Conservation Service 1986b) |
Subsurface Utilities computes two qu values by selecting C0, C1, C2 coefficients corresponding to the specified distribution type and the two Ia/P values that are closest to the computed Ia/P for the watershed. Subsurface Utilities then linearly interpolates between the two computed qu values to obtain the actual qu used to compute peak discharge. If the watershed’s computed Ia/P ratio exceeds the limits of Table F-1, the limiting value for Ia/P is used to compute qu (csm).