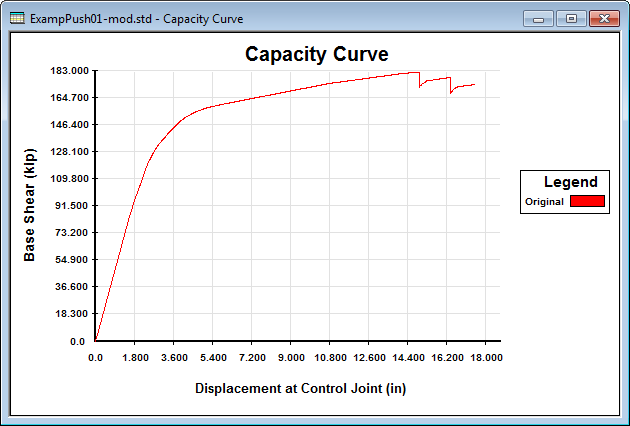
Capacity Curve graph
Displays the displacement versus base shear graph for the pushover analysis. The displacement at control joint is given if a control joint was specified as a solution control method. Otherwise, the displacement is taken largest Y nodes (i.e., the "roof" level).