G.17.3.6 Steady State and Harmonic Response
A structure [subjected only to harmonic loading, all at a given forcing frequency and with non-zero damping] will reach a steady state of vibration that will repeat every forcing cycle. This steady state response can be computed without calculating the transient time history response prior to the steady state condition.
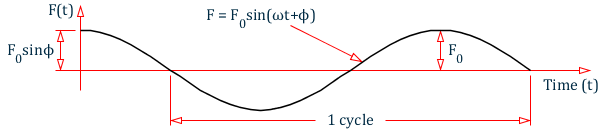
R(t) = R0sin(ωt + ϕ)
The result, R, has a maximum value of R0 and a phase angle ϕ . These two values for displacement, velocity, and acceleration at each joint may be printed or displayed.
This analysis is performed using the modal superposition method. Hence, all the active masses should be modeled as loads in order to facilitate determination of the mode shapes and frequencies. See G.17.3.2 Mass Modeling for additional information on this topic. In the mode superposition analysis, it is assumed that the structural response can be obtained from the "p" lowest modes.
| F(t) = F0sin(ωt + ϕ) |
| = | ||
| = | ||
| = | ||
| = |
The results are the steady-state response which is the absolute maximum of displacement (and other output quantities) and the corresponding phase angle after the steady state condition has been reached.
In addition, a Harmonic response can be calculated. This response consists of a series of Steady State responses for a list of frequencies. The joint displacement, velocity, or acceleration can be displayed as the response value versus frequency. Load case results are the maximums over all of the frequencies.
All results are positive as in the Response Spectrum and Time history analyses. This means section results should be ignored (BEAM 0.0 in Parameters for code checking). Because of this, you may want to add the steady state response to Dead & Live loads for one combination case and subtract the steady state response from those loads for another combination case.
Ground motion or a joint force distribution may be specified. Each global direction may be at a different phase angle.
Output frequency points are selected automatically for modal frequencies and for a set number of frequencies between modal frequencies. There is an option to change the number of points between frequencies and an option to add frequencies to the list of output frequencies.
The load case that defines the mass distribution must be the case just before the PERFORM STEADY STATE ANALYSIS command. Immediately after that command is a set of data starting with BEGIN STEADY and ending with END STEADY. The list of additional frequencies and the steady state load cases with joint loads or ground accelerations and phasing data are entered here. The optional print command for the maximum displacement and associated phase angle for selected joints must be at the end of this block of input.