P. To display time history graphs
To display data of time versus displacement, velocity, or acceleration, use the following procedure.
-
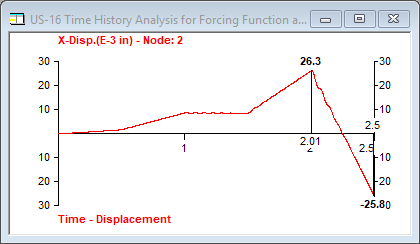
Select the time history response plot you want to view:
A set of three plots opens.To view… Select… Displacement data the tool in the Dynamics group Velocity data the tool in the Dynamics group Acceleration data the tool in the Dynamics group If you do not have any node groups defined in the model, you will asked if you want to define any now. If you opt to not create any now, you must select the Analytical workflow to define node groups.
-
Either:
Selecting a node group will display calculated average time history results for the desired response. This feature can be used to generate floor spectra at each floor level in a structure which can then be used as input for other dynamic analysis such as analysis of vibrating machinery existing on the floor.To graph data for… Select… a single node the node in the graphical view a node group that defines a floor the name of the node group in the Select Groups dialog -
To select the global direction of action displayed on the y-axis
for a plot:
- Right-click on the graph and select Diagrams from the pop-up menu. The Diagram dialog opens.
- Select global direction for the action. More than one global direction can be displayed on a plot.
- (Optional) Click the color block beside a global direction to specify a different color for the plot.
- Click OK.
-
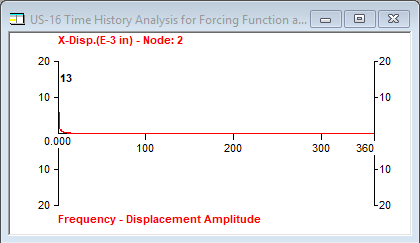
To change the x-axis of a graph to display frequency instead of
time:
This option performs a time-domain to frequency-domain transformation of the nodal displacement response due to time-varying load. STAAD.Pro graphs the amplitude information from a Fourier transform.
- Right-click on the graph and select Diagrams from the pop-up menu. The Diagram dialog opens.
- Select Frequency Domain and then click OK.
- (Optional)
To save the current set data to an external file:
- Right-click on the graph and then select Save data in a text file from the pop-up menu. A Windows File Open dialog opens.
- Select a location to save the data.
- Type a File Name and then click Save.
-
You can use pictures of the graph in other reports or external
programs by right-clicking on the graph and selecting:
Select… To… Copy Picture copy the graph to the Windows clipboard Take Picture save the image for use in reports for later use. A Picture dialog will open for a label and caption. Click OK to save the graph to the report Picture Album.