AD.2007-04.3.1 Time History Animation
In order to visualize the displacement that occurs on a model during the application of a time history load, a new toolbar icon has been added which allows the displacement at a specific time instance to be displayed.
The results toolbar has been updated to include a new option which is activated when the displacement diagram icon has been clicked and the current load case contains time history loading:
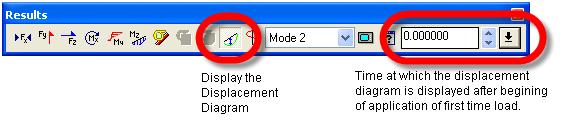
For a time history load case the displacement that is displayed will be defined by the time instance entered in the above edit box. Alternatively the time can be set from a sliding scale by clicking on the button with the down arrow icon which displays the following option setting:

The slider scale is based on the overall time for which the time history analysis has been performed.
The displacement is produced at the time at which the slider arrow is dragged to and the mouse button released.
If the Apply Immediately option is selected, then the application will attempt to render the displacement diagram dynamically as the slider is dragged up and down the scale of time. For large models this may prove to be too demanding on the graphics system and left un-checked which means that the displacement diagram will be produced at the time step at which the slider arrow is released.
Note that the displacement diagram will be set to the scale as defined in the Scales sheet in the Structure Diagrams dialog box.
Additionally note that it is possible to view the time v displacement of individual nodes by clicking on the Dynamics>Time-Disp in the post processing mode which is only available for models that include time history.