AD.2007-04.1.2 Floor Response Spectrum
A new dynamic feature has been added that allows the extraction of a response spectrum from a collection of nodes that constitute a floor when subjected to a time history loading. This information can then be used in conjunction with equipment that will be supported by these floors and is often required by the equipment manufacturers.
Users will require a license for the advanced analysis module to access this feature.
The required commands (see AD.2007-04.2.3 Floor Response Spectrum for more information) can be entered graphically after adding the analysis command by selecting the new analysis sheet Generate Floor Spectrum thus:
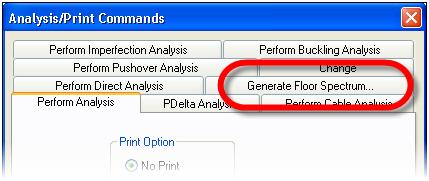
This command should follow immediately the definition of the analysis and will require defined groups of nodes which need to be defined first.
The following displays the layout of this sheet:

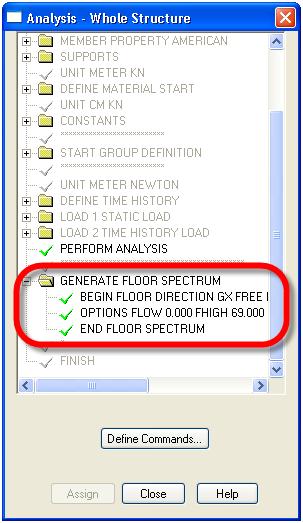
Once the required options have been set, click on the Add button to add the command set to the model which should appear in the Analysis Window thus:
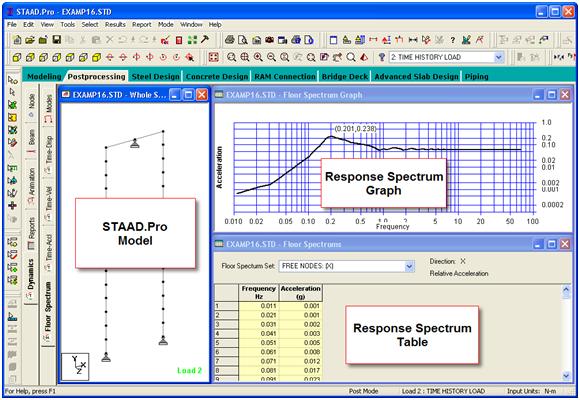
Once the command has been added and the file saved, the analysis can be run which will generate a new sub-page in the Post-Processing Mode in the Dynamics Page called Floor Spectrum:

Entering this page, STAAD.Pro will display the floor spectrum thus:
To change graphs to that of another selection of node groups or damping ratio, then
select the required set from the drop list in the Response Spectrum Table.
The graph is initially set to display the results on a log/log graph. This can be changed to a linear graph by right clicking on the graph and selecting the "Linear Graph" option. Additionally, the calculated points on the graph can be added by again right clicking on the graph and selecting the option ‘Show Points’.
The data that has defined the graph can also be exported to a text file and used in a third party application by right clicking on the graph and selecting the option "Save Data in Text File…"