T.2 Viewing the deflection diagram
-
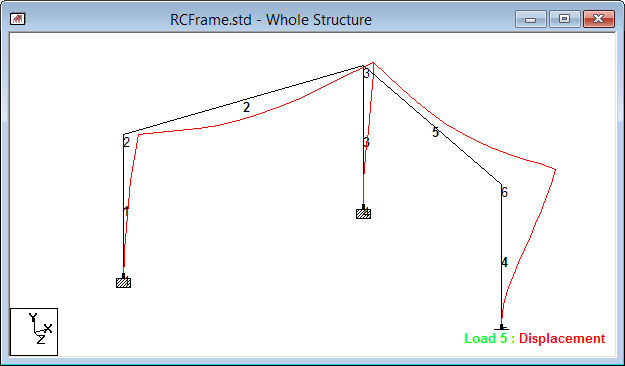
Select the
Displacement page in
Postprocessing page control bar.
Note: You can display the Deflection diagram on most results pages by selecting the Deflection toolThe displacement diagram is drawn on the structure. The Node Displacements table and Beam Relative Displacement Detail table open. See T.2 The Node Displacements Table for details on these tables.
 . The tool remains depressed when
the displacement is displayed.
. The tool remains depressed when
the displacement is displayed.
- (Optional) If the deflection is not exaggerated enough to clearly identify, you can change the scale:
-
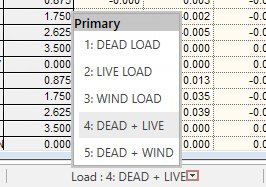
To change the load case being
displayed, select from the current
Load list in the window status bar.
Tip: Alternatively, select the Structure tool
 in the
Configuration group on the
Results toolbar. The active load case can be
selected on the
Load and Results tab in the
Diagrams dialog.
in the
Configuration group on the
Results toolbar. The active load case can be
selected on the
Load and Results tab in the
Diagrams dialog.
-
Annotate the deflection at specific nodes:
-
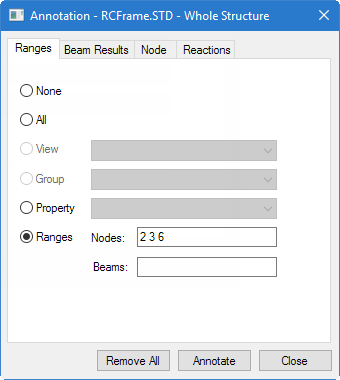
On the Results ribbon tab, select the
Annotate tool in the
Configuration group.

The Annotation dialog opens. - On the Ranges tab, select the Ranges option and then type 2 3 6 (spaced node number list) in the Nodes field.
-
Select the
Node tab and then check the
Resultant option.
Resultant stands for the square root of sum of squares of values of X, Y and Z displacements.
-
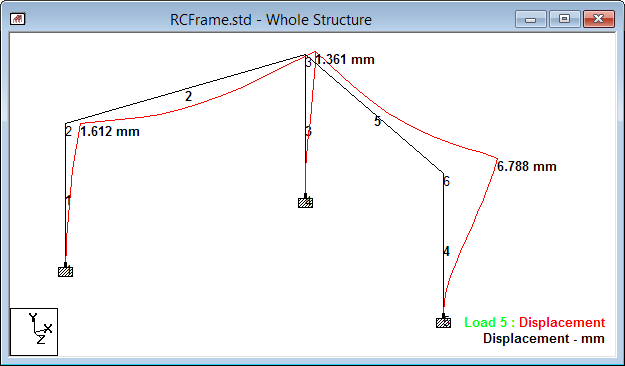
Click
Annotate and then click
Close.
The structure deflection diagram is annotated for load case 5, as in the following figure.
-
On the Results ribbon tab, select the
Annotate tool in the
Configuration group.
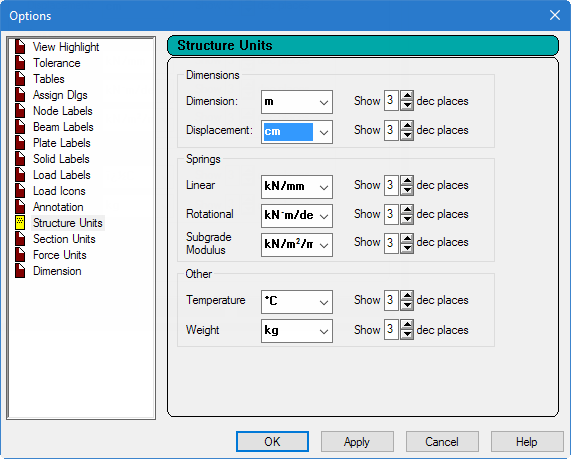
- Change the display units for displacement: The units in which displacement values are displayed in the post-processing mode are referred to as the display units.