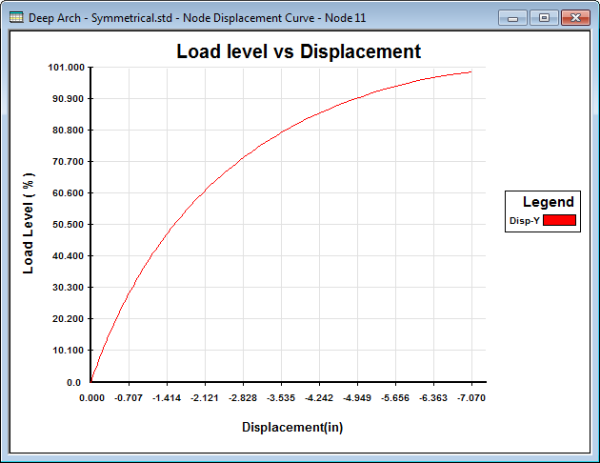
P. To display load versus displacement graph
To display the load level versus displacement curve for a selected node and load case, use the following procedure.
Load versus
displacement is only available after a geometric nonlinear analysis is
performed on the
STAAD.Pro model.
- Select the tool in the View Results group on the Results ribbon tab. The Node Displacement Curve and Node Displacements table open.
- Either: The plot for the selected node is displayed. If you select multiple nodes, then the graph will display the plot for the lowest node number.
- Select a Load in the View Results group on the Results ribbon tab. A nonlinear analysis must be performed for the selected load case.
- (オプション) Specify the Select Load Step in the Node Displacements table.
- (オプション) Check the Limit Maximum Load Step for Graph option in the Node Displacements table to limit the maximum load step displayed in the graph.
- To change the degree of freedom plotting on the graph: The graph and legend update to include the selected curves.
- (オプション) To include the current graph in a report: The picture is added to the picture album for inclusion in reports.