P. To display plate results along a cut line
To view the plate stresses along an arbitrary line cut across plate elements, use the following procedure.
- On the Results ribbon tab, select the tool in the View Results group. The Results Along Line dialog and layout open.
- In the Results Along Line dialog, click Cut by a Line.
- In the view window, click the start and end points of the line.
- Click a third point to define the cut direction. A perpendicular line is rubber banded to the mid-point of the line drawn in step 3. The line is added to the list and the in Max Absolute results along the line are displayed in the graph and table.
-
Customize the stress results:
- (Optional) Type a Name for the line.
-
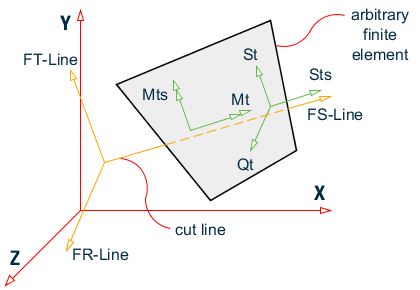
Select the Stress Type from the drop-down list.
- Options Max Absolute through Tressca Bottom (i.e., options with "(Line)") represent values across indiviual elements.
- Options St-Line through Qt-Line represent values that have been mathematical processed to be continuous across element boundaries and have forces in equlibrium along the cut line.
- Type a Max No Div to specify the number of equal divisions displayed in the graph.
- Click Update.
- (Optional)
Add the cut line results to the report:
- Click Create Report. The Report Title dialog opens.
- Check the Save Report option.
- Click OK.