Axial/Flexural
Results
This tab contains the results for the axial/flexural interaction evaluation of the Section Cut (See Figure below). The tabular axial/flexural results are listed for each load combination considered during the design run. The required axial force and moment, the orientation of the moment relative to the local major axis (denoted as β), and the interaction value are listed for each load combination. If the interaction value is greater than unity, the line is colored red. When a row is selected with the mouse or the arrow keys, the locally and globally-oriented moments corresponding to the load combination are shown below the spreadsheet region.

Interaction Surface
This tab shows the interaction surface diagram for the Section Cut. There are two possible view modes: the P versus M curve view, and the Mmaj versus Mmin curve view. Either of these is activated by toggling the respective button above the curve display.
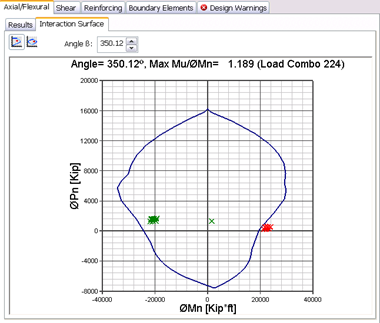
The P versus M view shows the two-dimensional axial versus moment capacity curve at the selected angle β from the local major axis. The Mmaj versus Mmin curve view shows the two-dimensional capacity curve at the selected value P. The evaluated load combinations (Pu, Mu,maj, Mu,min) are plotted in the display if they occur within a tolerance of the plane in which the capacity curve lies.
To snap directly to a plane than contains one of the evaluated load combinations, first select the corresponding row on the Results tab, and then select the Interaction Surface tab. This will draw the curve in the plane at which the selected load combination lies.