Submittal trends tab
The Submittal trends tab has charts that show:
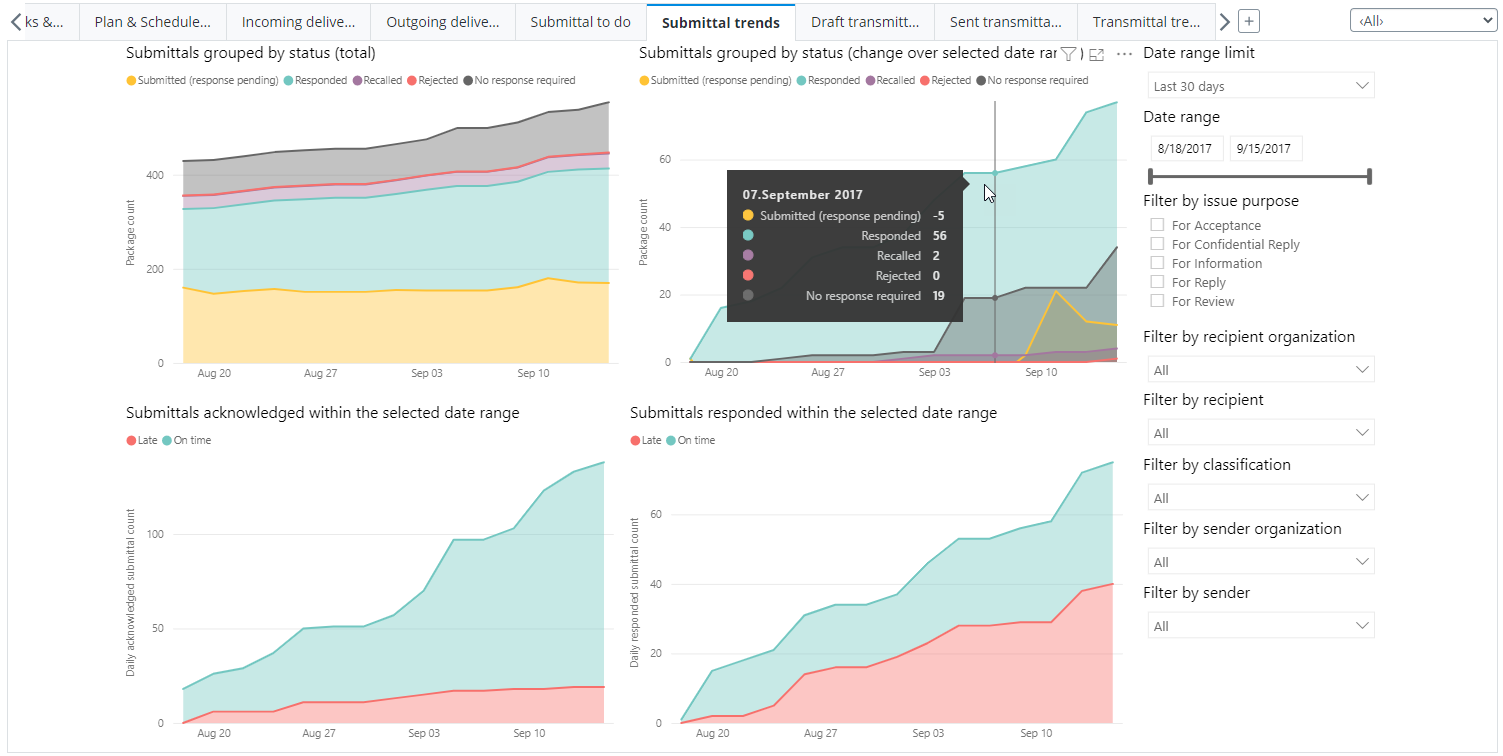
- Submittals grouped by status (total) - Shows the total number of submittals in each status over the lifetime of the project. The chart is a snapshot of the total number of submittals within the specified date range. You can click in the chart to see how many submittals are in each status on a particular day. This chart is similar to the next chart, except that in this chart, the date range also includes all the submittals in the project prior to the specified start date.
- Submittals grouped by status (change over selected date range) - Similar to the previous chart, except that in this chart, the date range does not include any of the submittals in the project prior to the specified start date (the counting of submittals begins at the specified start date of the date range).
- Acknowledged within the selected date range - Shows how many submittal acknowledgements within the selected date range were on time or late. The date range does not include any of the submittals in the project prior to the specified start date (the counting of submittal acknowledgements begins at the specified start date of the date range).
- Responded within the selected date range - Shows how many submittal responses within the selected date range were on time or late. The date range does not include any of the submittals in the project prior to the specified start date (the counting of submittal responses begins at the specified start date of the date range).