Working with Custom Reports in the Dashboard
You can add custom reports to the dashboard if you need to display your ProjectWise data in a way that is not offered on any of the standard report tabs.
About Microsoft Power BI Visualizations
Just like the standard report tabs, any custom report you create also uses Microsoft Power BI report functionality. See the Microsoft Power BI documentation for detailed information about how to create visualizations (the actual charts that contain data on the report tabs) in Power BI, starting here:
https://docs.microsoft.com/en-us/power-bi/visuals/power-bi-report-add-visualizations-i
The Visualizations and Fields tabs are standard Power BI functionality, but the document grouping options that are available on the Fields tab are the environment attributes that are assigned to the work area that is associated to this ProjectWise project.
Adding Your First Custom Report(s)
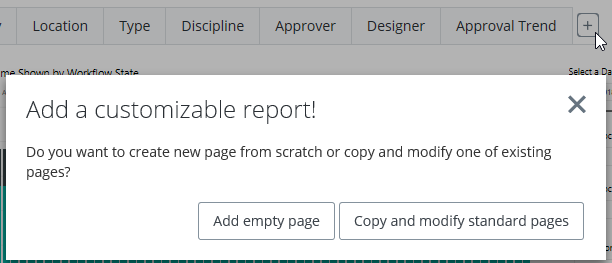
- To begin adding a custom report, click the + button to the right of the last report tab.
- In the window that opens:
- Use the standard Power BI visualization controls (on the right) to add and modify charts on the custom reports as needed.
- To add more custom tabs, click the + button that appears to the right of the custom tabs at the bottom of the page.
- Click the Save button to save changes as you are working.
- Click Stop editing, and then Yes, to save the custom reports and go back to the dashboard.
Your new custom report tabs appear along side the standard report tabs.
Adding More Custom Reports
If your dashboard already contains a custom report, you need to start editing one of the custom tabs.
- To begin adding more custom reports, select one of the custom report tabs and click the pencil (edit) icon, or click the + button to the right of the last report tab.
- When the custom report opens, displaying all of the custom report tabs, click the + button that appears to the right of the custom tabs at the bottom of the page.
If you ever need to remove a custom report tab from the dashboard, you have three options: hide the custom report, delete the custom report, or delete all the custom reports.
Hiding Custom Reports
To hide a custom report tab without deleting it, go to and then click Hide on the custom report tab in the list that you want to hide. You can then click Unhide when you are ready to display the custom report tab again.
Deleting Custom Reports
To delete a single custom report tab, first select one of the custom report tabs and click the pencil (edit) icon. This opens all of the custom report tabs for editing. At the bottom of the page, place your cursor over the right corner of the custom tab you want to delete and click the x button (Delete page) and click Delete when prompted, then make sure you Save the custom report to permanently delete this custom tab.
To delete all of your custom report tabs in one step, go to and then click the Delete Custom Report button.