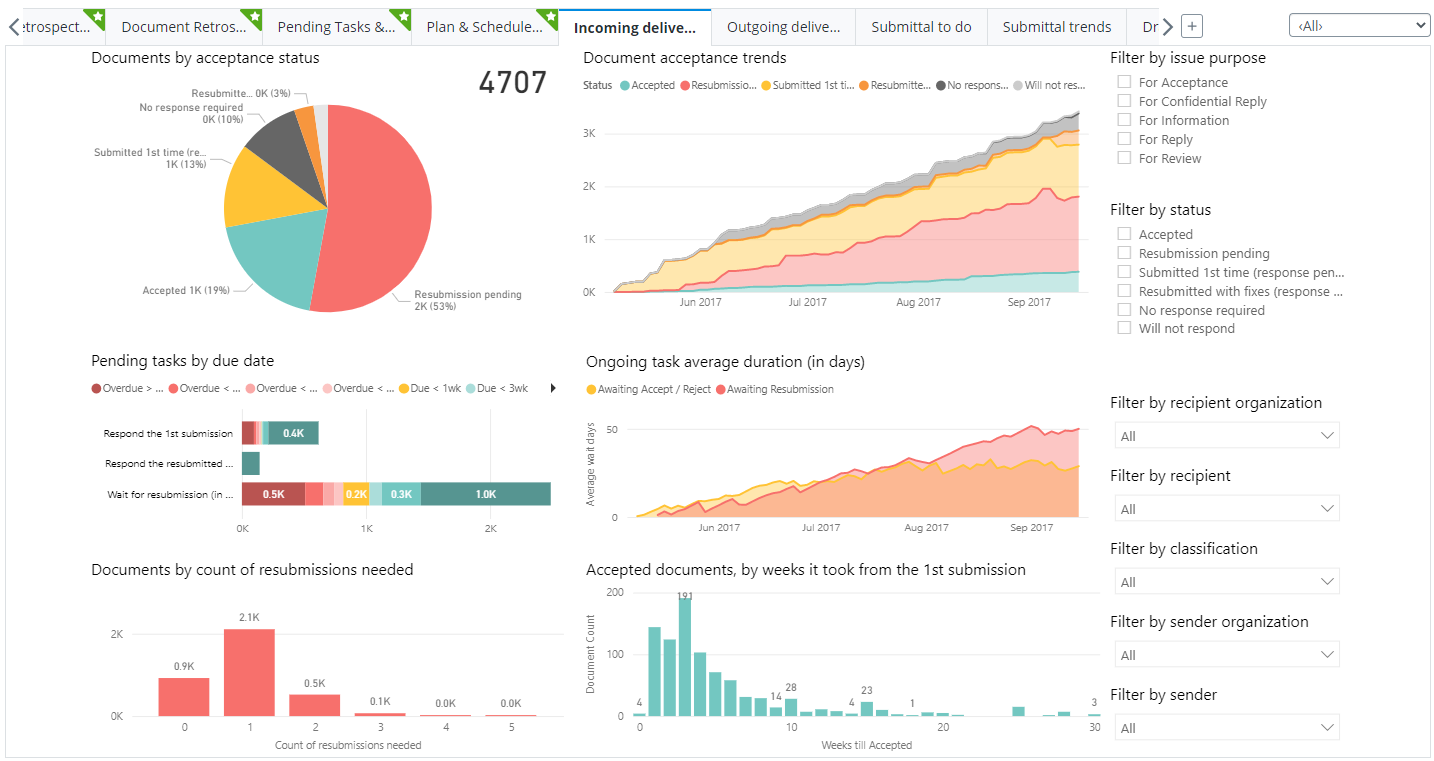
Incoming deliverables tab
The Incoming deliverables tab contains the following charts to provide an overview of the status of your project's incoming deliverables:
- Documents by acceptance status
- Document acceptance trends
- Pending tasks by due date
- Ongoing task average duration (in days)
- Documents by count of resubmissions needed
- Accepted documents, by weeks it took from the 1st submission
These charts will help you track the time it takes for documents to be fixed and accepted. Analyzing the task average duration will give you an insight into what might be a potential bottleneck in your processes.
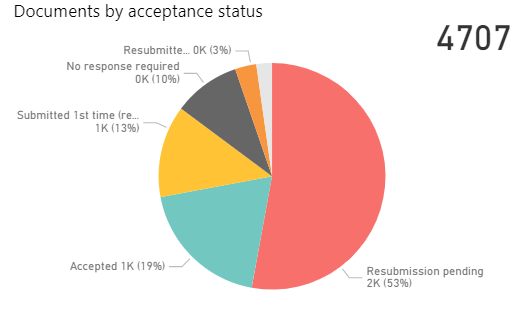
Documents by acceptance status
This chart shows the total number of incoming deliverable documents and their current status in your project. The chart counts the following document statuses:
- Accepted - the number of documents in received submittals that have been accepted
- Returned to fix - the number of documents in received submittals that were rejected and need to be fixed and reissued
- Issued 1st time (response pending) - the number of first version documents that have been received, but not responded yet
- Reissued with fixes (response pending) - the number of documents in received submittals that have been rejected and for which a newer version has been issued and received, but not responded yet
- No response required - the number of documents in received submittals that does not require responding
- Will not respond - the number of documents in received submittals that have been responded using the "Will not respond" response
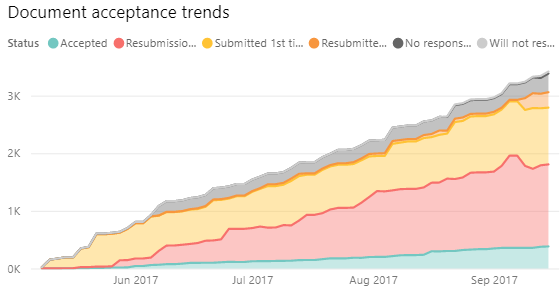
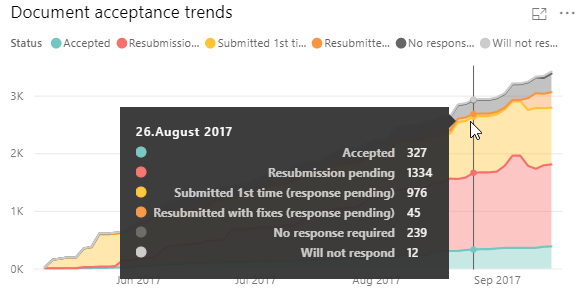
Documents acceptance trends
This chart shows an overview of all the incoming deliverable documents and their status at any point in time throughout the life cycle of the project.
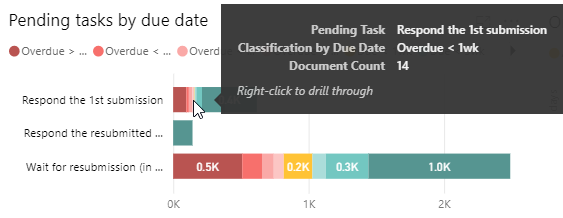
Pending tasks by due date
This chart shows the number of deliverable documents that have some action pending and if the action is overdue. This chart might help detect some potential bottlenecks in the external review process.
- Respond the 1st submission - the number of first time received documents that are pending response
- Respond the resubmitted documents - the number of resubmitted documents that are pending response
- Wait for resubmission (in 14 days by default) - the number of responded documents that are pending resubmission
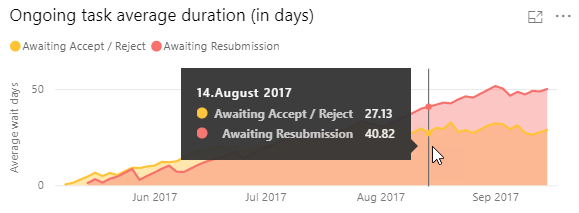
Ongoing task average duration (in days)
This chart shows the average duration (in days) for all outstanding tasks at any point in time for the duration of the project. This chart might help detect some potential bottlenecks in the external review process, that might have occurred during the project life cycle.
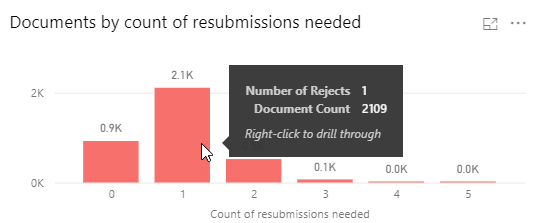
Documents by count of resubmissions needed
This chart shows the number of times each deliverable document has been rejected and needed to be fixed and resubmitted.
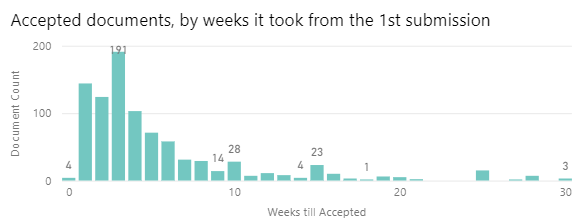
Accepted documents, by weeks it took from the 1st submission
This chart shows the distribution of project document by the number of weeks it took to approve the documents.
- How long on average does it take to approve project documents?
- Are there some documents that took unusually long to approve? If so, what are those documents and what part of the project do they belong to (right-click and select Drill through to see specific documents)?
- Might help detect some unplanned project changes, or higher complexity in specific parts of a project
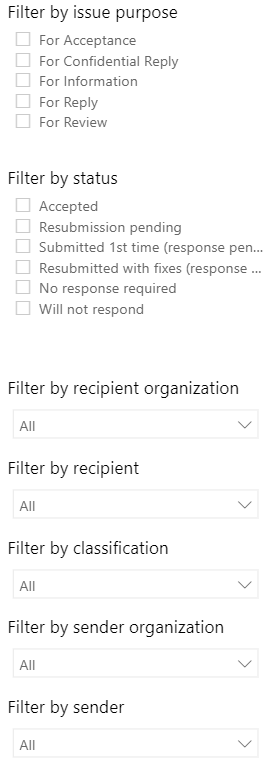
Filtering information on the Incoming deliverables charts
You can filter by:
- issue purpose - the purpose of the submittal package the document was received with
- status - the current document status
- recipient organization - the organization the document was sent to (for when you are working in a Joint Venture project)
- recipient - the recipient of the document
- classification - the classification of the submittal package the document was received with
- sender organization - the organization the document was sent from
- sender - the sender of the document
See What Documents Are Included in a Specific Chart or Metric (to perform root cause analysis)
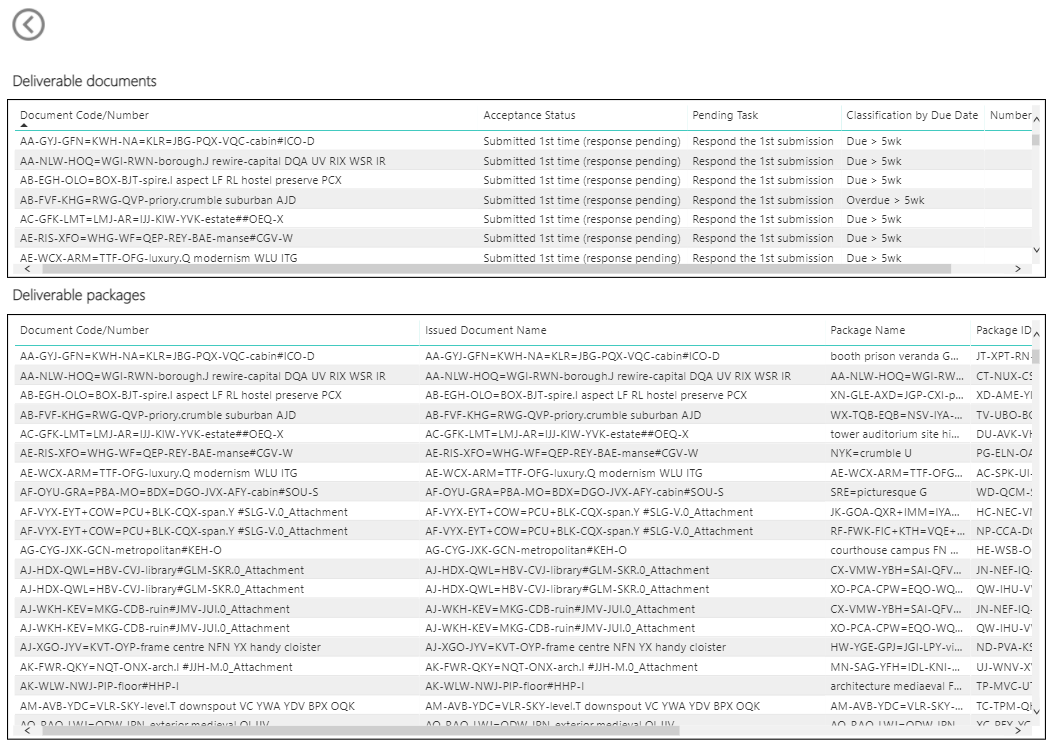
If you want to see a list of the deliverable documents and packages that are included in a specific chart or metric, right-click inside that chart and select . This opens the Submittal Documents and package lists page which has two tables:
- Deliverable documents - lists all the deliverable documents that belong to your previously selected chart segment
- Deliverable packages - lists the deliverable packages that those documents were received/sent with.
For example, if you want to know what the exact documents that your organization has received and are overdue to respond, you can right-click the Submitted 1st time (response pending) segment in the Documents by acceptance status chart and select .
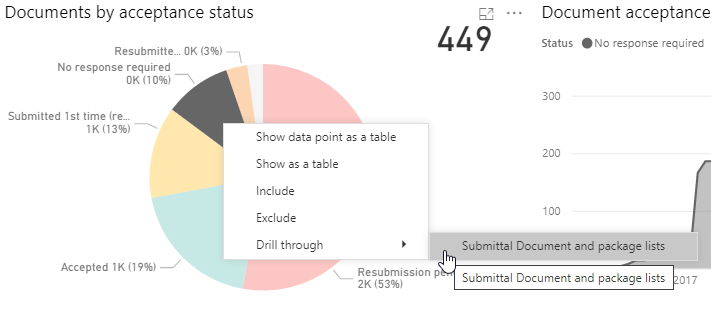
The Submittal documents and package lists page opens, which shows the list of documents and packages that have been received and whose responses are overdue.