3D View
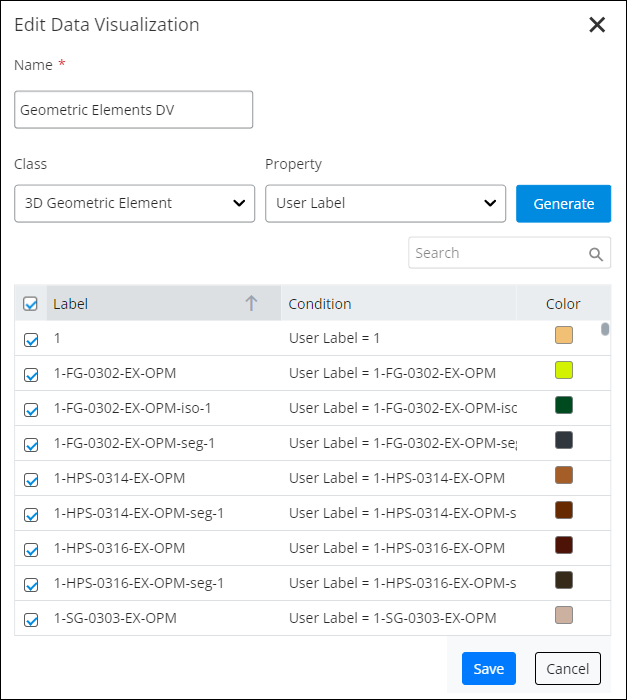
Using 3D View, you can create views that highlight certain
classes of objects in the digital twin in different colors. Clicking
![]() expands the Viewer
settings. For example,
expands the Viewer
settings. For example,
Using 3D View, you can create views that highlight certain
classes of objects in the digital twin in different colors. Clicking
![]() expands the Viewer
settings. For example,
expands the Viewer
settings. For example,
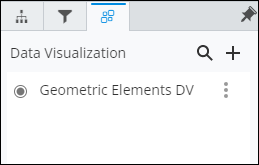
 Search
 Create
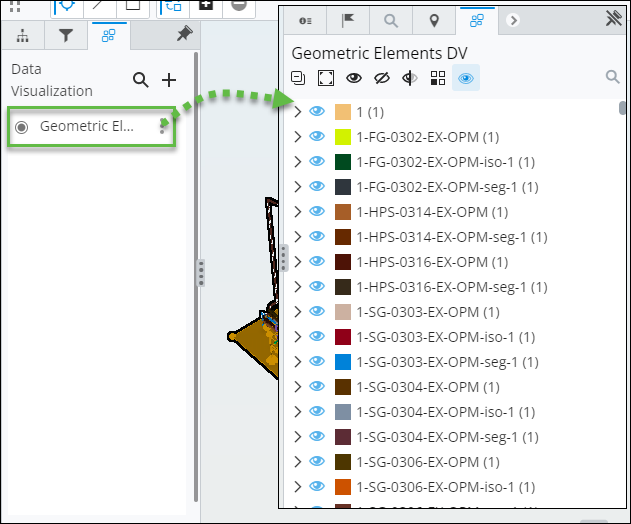
 Collapse All
 Zoom to Selected Elements
 Show All
 Hide All
 Invert Display
 Isolate
 Emphasize