| Name
|
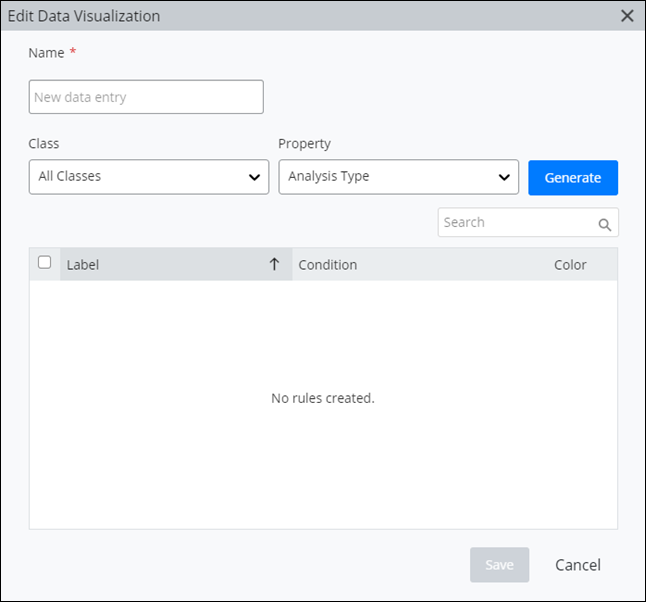
Used to enter a name for the visualization.
|
| Class
|
Select a Class for the visualization.
|
| Property
|
Select a property for the selected Class that
the visualization will be based on.
|
| Generate
|
Click to generate the data visualization.
|
| Table columns
|
Display,
Label,
Condition and
Color are the table headings. Label
and Condition are read only. Check/uncheck in the
Display column to hide or show the
line items. In the
Color column, click on the color
swatches to change the color of the line items.
|
| Save
|
Saves the visualization, closes Edit Data
Visualization, and returns you to the 3D View. The new data visualization
appears on the list of saved data visualizations.
|
| Cancel
|
Discards changes and closes Edit Data
Visualization.
|
 Used to create views that
highlight certain classes of objects in the digital twin in different colors.
Click to expand the Data Visualization settings.
Used to create views that
highlight certain classes of objects in the digital twin in different colors.
Click to expand the Data Visualization settings.

 ) to create a new visualization.
Opens the Edit Data Visualization dialog.
) to create a new visualization.
Opens the Edit Data Visualization dialog.