Regression Line from Points

You can access this dialog from the following:
Regression Line from Points tool takes a set of points and puts them into a proper order creating a linestring (regression line). The data anticipated by this tool is typically a survey representing the centerline or rail readings. The points are seen as xy pairs. No point elevations are involved in this tool, but the points should have elevations defined if performing vertical regression analysis. If points contain elevation information, a vertical profile representing the point elevations is also added to the created regression line.
Provide the first and second points for the tool. The first data point identifies a starting point within the group of points. The second data point identifies an "adjacent" point within the group of points. These two points specify a direction (from the first identified point toward the regression line, starting from the first identified point and going towards the second. Point numbering is not important for this tool to work.
Ordering the Points
The first and second points that you identify establish both a starting point and a direction along the "string" of regression points. The first data point identifies a starting point within the group of points. The second data point identifies an "adjacent" point within the group of points. These two points specify a direction (from the first identified point towards the second). The two points are in order - the task of the software is to find the next point and then the next one and so on. The ordering of the other regression points proceeds one point at a time as described below.
Searching for the next regression point, the tool first searches for candidate points. The search begins at the current point, the most recently established regression point. Points considered as candidate point must satisfy three tests. They must be farther away than the Minimum Distance Tolerance, they must be closer than the Maximum Distance Tolerance, and they must fall within a certain zone, which limits the search to those points that lie in the path of the previously sorted points.
The zone covers the area along either side of a line projected through the current point and the previous point. The extent of the zone on either side of the projected line is equal to the distance defined in the Maximum Deviation parameter.
The following diagram shows the minimum and maximum distance tolerances as the smaller and larger circles. (Point 1 is the current point.) Of the three dashed lines, the middle one indicates the line projected through the current point (1) and the previous one. The upper and lower dashed lines, which are offset from the middle dashed line by the Maximum Deviation, represent the extent of the zone. Points must fall inside the zone to be considered as candidates.
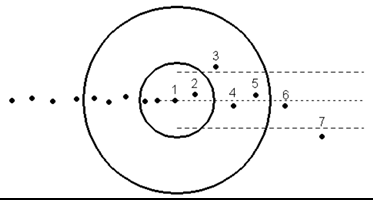
The following list describes each numbered point in the diagram and whether or not it is a candidate to be the next regression point. If the point is not a candidate, the reason is given.
- the current regression point, we are looking for the next one
- no, closer than the Minimum Distance Tolerance
- no, beyond the Maximum Deviation
- yes, a candidate (satisfies all three criteria)
- yes, a candidate (satisfies all three criteria)
- no, beyond the Maximum Distance Tolerance
- no, beyond the Maximum Distance Tolerance and beyond the Maximum Deviation
The two candidates are points 4 and 5. Because point 4 is the closest to the current point, it becomes the next regression point. As the command proceeds, point 4 becomes the current point, and the search for the next point begins again.