Horizontal Curvature Diagram

You can access this dialog from the following:
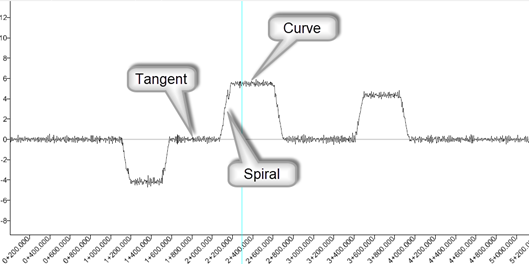
This tool displays a diagram representing curvature along the path of regression points in a horizontal alignment. While regression analysis can be done directly on the regression line, a curvature diagram makes it easier to identify curves, tangents and spirals. This tool operates on raw regression line; you do not need to perform any regression analysis before running this tool.
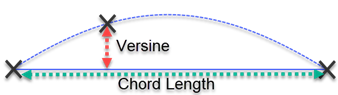
The horizontal axis represents stationing along the alignment. The vertical axis represents deflection of each point relative to its neighboring points. Raw vertical values are calculated as follows.
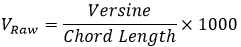
After finding the raw values, a rolling average calculation is applied to smooth out the fluctuations and obtain the final values.
The absolute value of the vertical does not provide much information about the geometry. It is the relative value of the points that represents the curvature. In the diagram points closer to horizontal axis have low deflection values, which means these points are on a tangent line. Points that are away from horizontal axis represents curves. Transition zones, that is the deflection of the points is increasing or decreasing, represents transition curves, spirals. The sign of the vertical value is negative for left-hand curves and positive for right-hand curves.