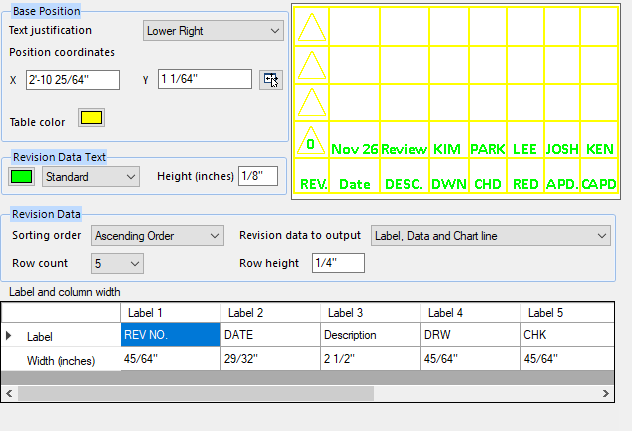
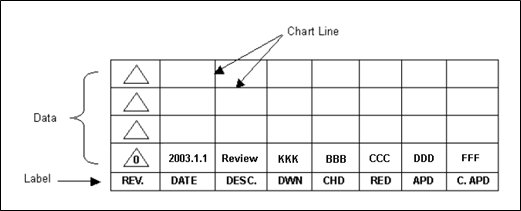
The page provides options to define a Revision History
Chart in the drawing. This chart is not a necessity but is helpful to use for
testing or checking the drawing.
Accessed by selecting the
Lists and Reports > Revision Table node in
the
Settings interface.
Define the properties per the fields described below and
Save the changes.
The Close icon closes the Project Settings interface, so
make sure your changes are saved. You will be prompted to save them it you
haven't already.
The Load Defaults icon in the main
Settings interface will return the settings of the options
page to their original values.
| Setting | Description |
|---|
| Base Position
|
-
Text Justification: This option
determines the base point from which the Revision Chart is placed in the
drawing. Select from Upper Left, Lower Left, Upper Right or Lower Right.
-
Position coordinates: You can opt to
enter an exact position directly in the Position X and Position Y fields or
click the Position Locate
 icon to the right of the fields
to pick the position in the drawing. icon to the right of the fields
to pick the position in the drawing.
-
Table Color: Click the icon and
select a color from the Color Table for the chart grid lines.
|
| Revision Data Text
|
In this section define the properties for the
Revision data text.
-
Color: Click the icon and select a
color from Color Table for the label text.
-
Text Type: Select a text type for the
label from the drop down list. You can click the "..." option at the bottom of
the list to display the Microstation Text Styles dialog allowing you to modify
the text styles if desired.
-
Text Height: Enter a text height
dimension into the field provided.
|
| Revision Data
|
-
Sort Order: Select the sort order (
Ascending or Descending).
-
Revision data to output: Select one
of the options to define how the Revision Chart will be displayed:
- Data Only
- Label and Data
- Label, Data and
Chart Line
-
Row Count: Enter a maximum number of
rows for the chart.
-
Row Height: Enter a height for the
chart rows.
|
| Label and Column Width
|
Use these fields to define the width of the columns
in the Revision Chart.
|