| Temperature Frequency
|
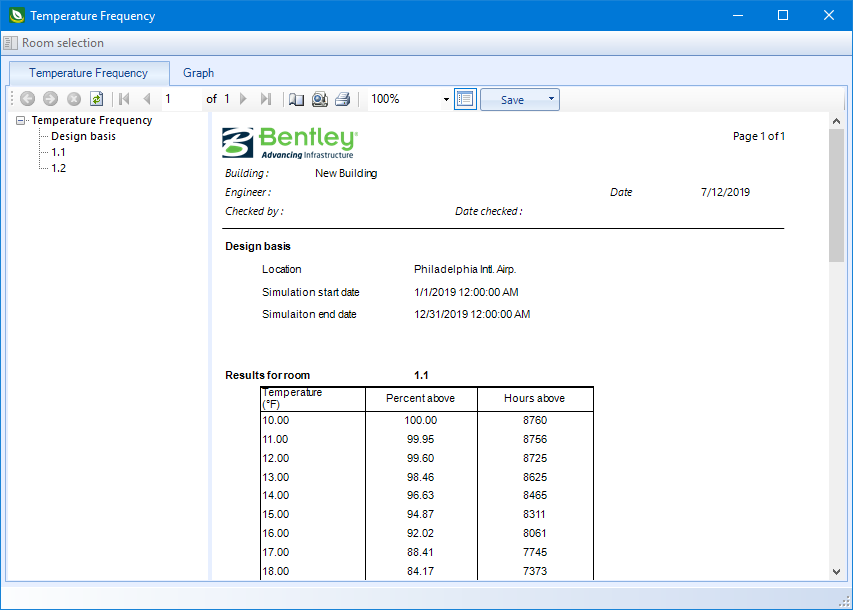
Lists the distribution of temperature values above the percent
and above the hours for each room.
|
| Graph
|
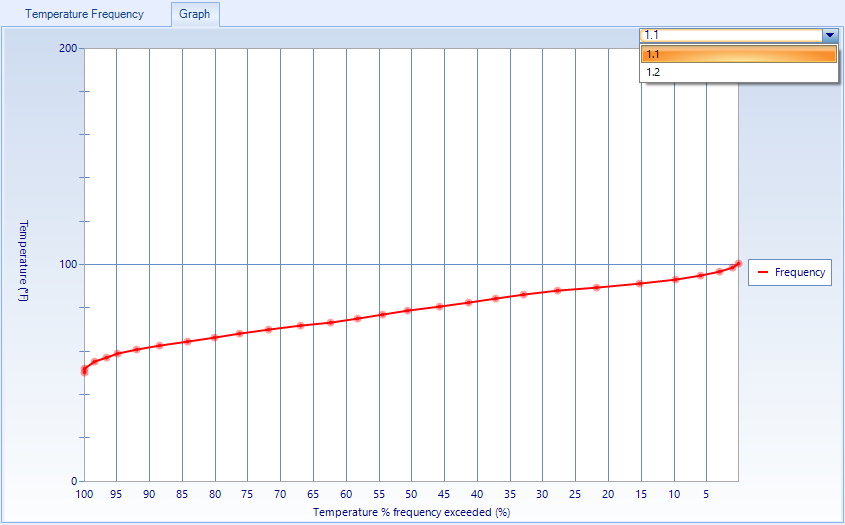
Contains controls used to view a graphical report of the
simulation temperatures result. Select a room from the list to update the
graph.
The temperature frequency graph for selected room can be
displayed. The pattern of the temperature exceeding the above is shown as a
colored curve.
- Temperature - The
temperature values are displayed on the graph's vertical (Y) axis. The scale is
automatically adjusted when viewing smaller or larger values making it easier
to distinguish the separate graph curves.
- Temp frequency
exceeded - The percentage values of the design temperature exceeded are
displayed on the graph's horizontal (X) axis.
- Curve - Temperature
distribution patten for the selected room or project are displayed with color
coded curves. The color codes are described in the graph legend. The curves and
legend are interactive, providing you with pop up help windows.
|