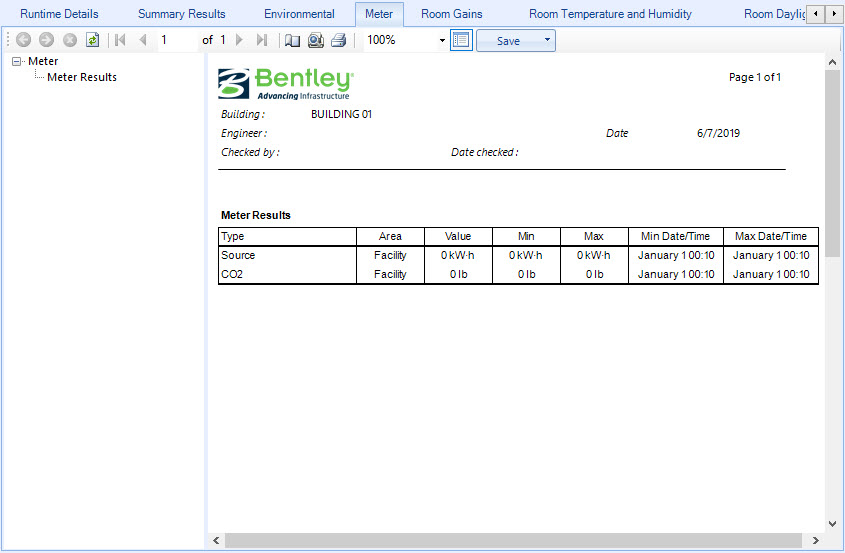
Meter tab
Contains controls used to view simulated power consumption or Meter data including minimum and maximum power consumption and corresponding dates for different areas of the project building.
Tip: You can
open the
Results
Viewer
utility to step through the calculations for displayed results
by selecting the result value and clicking for more information (as prompted).
| Setting | Description |
|---|---|
| Meter Results | Located in the left panel of the Meter tab, Meter Results is selected by default, which displays the meter results on a table in the data display panel on the right side of the Meter tab. |
| Type | Displays the power consumption Type in each table row. Type can be a fuel source like electricity or gas, equipment, or lighting. |
| Area | Displays the Area classification for each power consumption Type. |
| Value | Displays the total simulated power consumption value for each Meter Type and Area. |
| Min | Displays the smallest simulated power consumption value for each Meter Type and Area. |
| Max | Displays the largest simulated power consumption value for each Meter Type and Area. |
| Min Date/Time | Displays the date and hour of the smallest power consumption value in the simulated time period. |
| Max Date/Time | Displays the date and hour of the largest power consumption value in the simulated time period. |