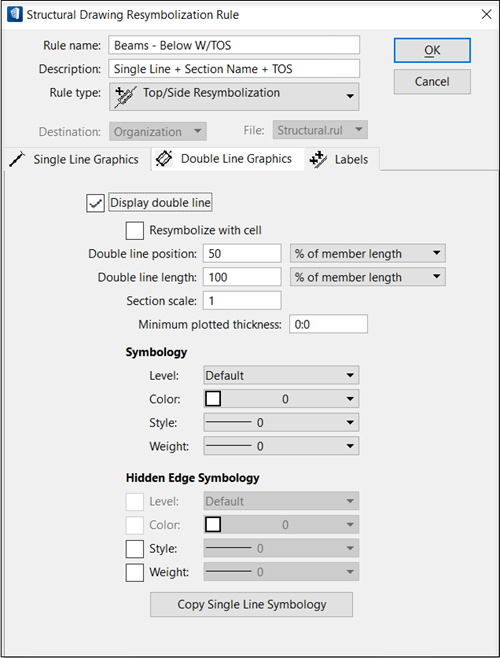
| Display double line
|
When on, enables access to double line
resymbolization settings.
|
| Double line position
|
When Resymbolize with cell is turned off, controls
the position of the double line. The position is either % of member length or
distance from an end, depending on what you select in the Double Line position
option menu. Key in the value in the text box provided.
- % of
member length – Specifies that the double line will be placed at
this percentage of the member length. (50% is midpoint, for example.)
-
Distance from end 1 – Specifies that the
double line will be placed this distance from end 1 of the member.
-
Distance from end 2 – Specifies that the
double line will be placed this distance from end 2 of the member.
|
| Double line length
|
Controls the length of the double line. The position
is either % of member length or a specified distance in the plot, depending on
what you select in the
Double line length option menu. Key in the
value in the text box provided.
-
% of member length – Specifies that the
double line length will be this percentage of the member length.
- In
plot – Specifies that the double line will have this length in the
plot. If you chose a position of 50%, a length of 1:0, and a value of In plot,
the double line would be placed at the midpoint of the member for a length of
1:0 units.
|
| Section scale
|
Sets the scale factor for the display of the double
line portion of the member. This affects the width of the double-line portion,
including all web and flange thicknesses.
|
| Minimum plotted thickness
|
By default, this value is set to 0:0, which means
that the two lines in the double line are right next to each other. Set this
field to a larger value (0:0 1/64, for example) to have the two lines separated
slightly. This will make the double lines much easier to see, especially if
your plotter tends to bleed together two very close lines.
|
| Copy Single Line Symbology
|
Click this button to duplicate the symbology you
have already set for single lines. Then, if you want to, you can alter that
symbology for your double lines without having to set all the fields.
|
| Resymbolize with cell
|
When turned on, enables access to cell position and
scale fields and option menus. The name of the user-defined cell to use in
place of a to-scale representation.

-
Cell position — When
Resymbolize with cell is turned on,
controls the position of the cell that will be used for the double line. The
position is either % of member length or distance from an end, depending on
what you select in the
Cell position option menu. Key in the
value in the text box provided.
Note: The
Cell used for double line graphics
comes from the
Annotation_DG.cel file which is placed
in the
Cell folder of the respective
datasets. Create a new cell to be used for double line graphics in this file
and then enter the exact
Cell name in front of
Resymbolize with cell option.
- % of
member length – Specifies that the cell will be placed at this
point of the member length. (50% is midpoint, for example.)
-
Distance from end 1 – Specifies that
the cell will be placed this distance from end 1 of the member.
-
Distance from end 2 – Specifies that
the cell will be placed this distance from end 2 of the member.
-
Cell X Scale option menu — Select one of
the following values:
- Cell
X Scale – Lets you set the scale of the cell along the X-axis.
-
Length in Plot – Lets you set the
length of the cell in the drawing.
- Cell Y
Scale option menu — Select one of the following values:
-
Cell Y Scale – Lets you set the
scale of the cell along the Y-axis.
-
Height in Plot – Lets you set the
height of the cell in the drawing.
|
| Symbology
|
Sets the symbology for the double lines. When
resymbolizing with cell, check boxes appear that are used to override cell
graphics symbology.
-
Level — Sets the level for visible
double lines.
-
Color — Sets the color for visible
double lines.
-
Style — Sets the line style for visible
double lines.
-
Weight — Sets the line weight for
visible double lines.
|
| Hidden Edge Symbology
|
Hidden edges are those that are covered by another
item in the drawing (the center line of a beam that is turned off so that you
cannot see the center line, for example). Even if you set the symbology for
hidden edges here, you must also turn on the hidden edges on the
Forward/Reflected Views controls on View Attributes dialog Building panel
General tab for these settings to be used in
the drawing composition process.
-
Style — Sets the line style for hidden
double edges.
-
Weight — Sets the line weight for hidden
double edges.
Note: Level and Color fields are not applicable for Hidden edge
Symbology.
|