| View
|
Contains controls used to set the
Simulation Results display format.
- Object
Based - Arranges simulation results by object in a hierarchical
structure similar to the project tree dialog. The top level objects are:
- Environment
- Facility
- Room
- Variable
Based - Arranges simulation results as a list of report variables
with related objects listed hierarchically within.
- Flat
List - Arranges simulation results in a flat list with data
displayed in the following columns:
- Simulation:Building Name
- Objects
- Variables
- UnitName
- Time Step
|
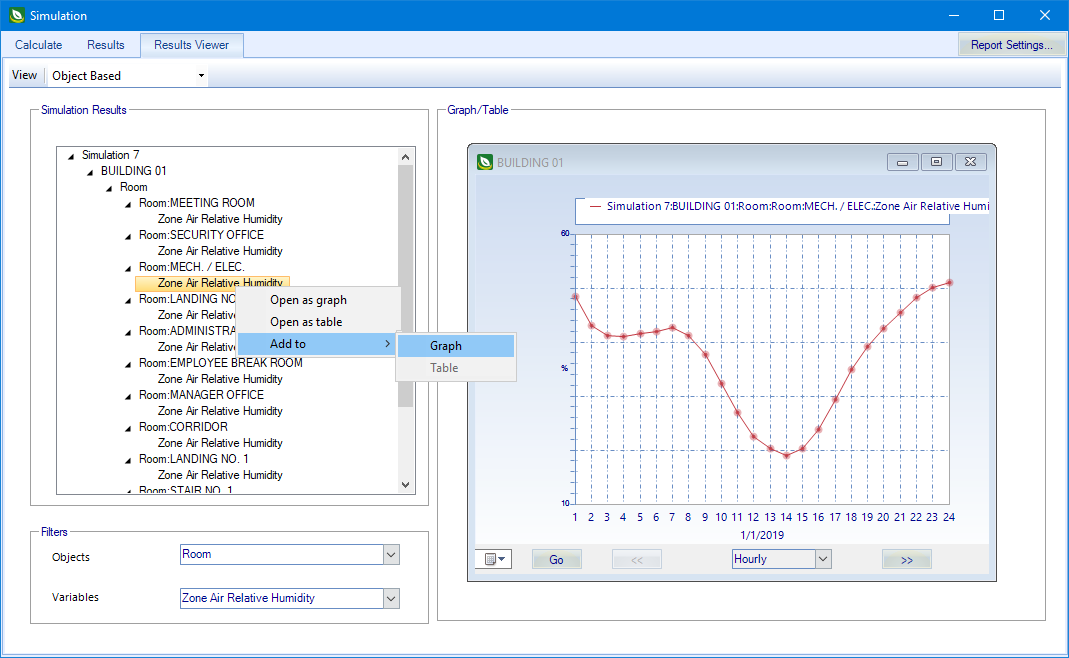
| Simulation Results
|
Displays simulation results in the format selected
with the View controls. Items selected from here can be opened in the
Graph/Table panel using the options on the
right click pop up menu:
- Open as
graph - When selected. selected report items are displayed
graphically in the
Graph/Table panel.
- Open as
table - When selected. selected report items are displayed in
tabular form in the
Graph/Table panel.
- Add
to - Used to overlay selected report items on already opened
results in the
Graph/Table panel.
- Graph - When
selected, adds the selected item to the active item being displayed graphically
in the
Graph/Table panel creating a graph
displaying multiple report items.
- Table - When
selected, adds the selected item to the active item being displayed in tabular
form in the
Graph/Table panel creating a table
displaying multiple report items.
|
| Filters
|
Contains controls used to filter the objects listed
in the
Simulation Results panel. Available filters
are refreshed when the
View options are changed.
- Objects - Use
the drop list to select objects to use as filters in the
Simulation Results panel. Only the
selected objects are displayed.
- Variables - Use
the drop list to select variables to use as filters in the
Simulation Results panel. Only the
selected variables are displayed.
|
| Graph/Table
|
Displays selected simulation results items
graphically or in tabular form. The graph or table windows contain these
navigation controls:
- Date selector - Used
to select a date within the simulation time period to display in the
graph/table.
- Go - Click to
advance to the date selected with the date selector.
- << -
Click to return to the previous date selected with the date selector.
- Time Step - Used to
change the time steps the simulation results are displayed with.
- >> -
Click to advance to the next date selected with the date selector.
|