Structural Report Spreadsheet tool
 Opens the Microsoft Excel
STF Quantity ReportV8.xls spreadsheet, which is
used to report on steel weights by unit weight per length or by exact volumes
multiplied by density.
Opens the Microsoft Excel
STF Quantity ReportV8.xls spreadsheet, which is
used to report on steel weights by unit weight per length or by exact volumes
multiplied by density.
| Setting | Description |
|---|---|
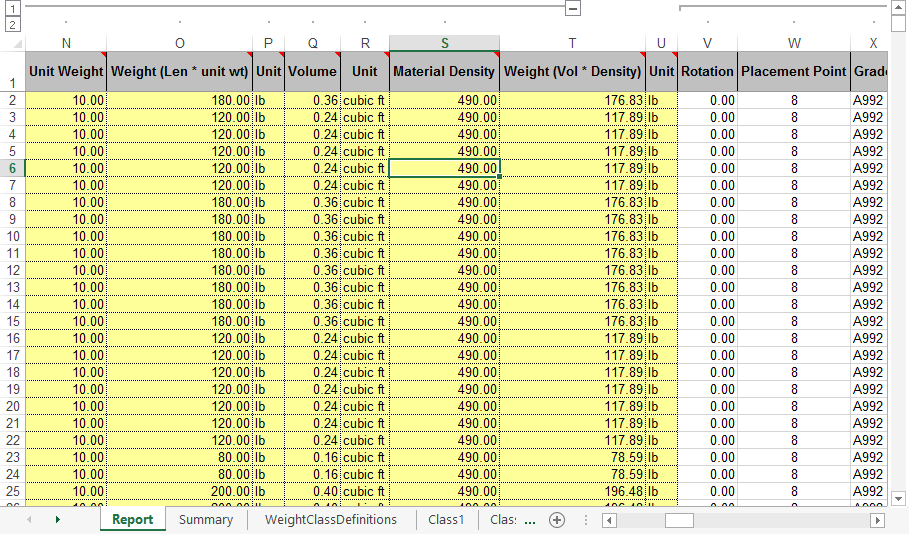
| Report sheet | Appears first when you create the spreadsheet. It lists the elements in your model. The columns are headed by Unit Weight, Volume, Material Density, and so forth. You will see a small red triangle at the top of many of the columns. These red triangles are comments embedded in the spreadsheet and are definitions of what each column contains. There are two distinct colors in the columns of data - white and yellow. You can edit the data in the white columns, because it represents the type of data. For example, you can change a steel beam to a steel girder, and you can change the section name from W10X12 to W18X35. The data in the yellow columns cannot be edited. They are measurements either directly from the model (such as length of the element) or calculated using the model data and the section file data (such as weight of the member equal to length times unit weight). The section file is the file that contains the acceptable section names and all data associated with them. |
| Summary sheet | Summarizes your data for you by section name. There is a drop-down list associated with the Section Name column. If you click on the down arrow, it shows a list of the sections that will be summarized and included in this list. Because these are keyed by section name, only Structural elements with section names will be listed here. |
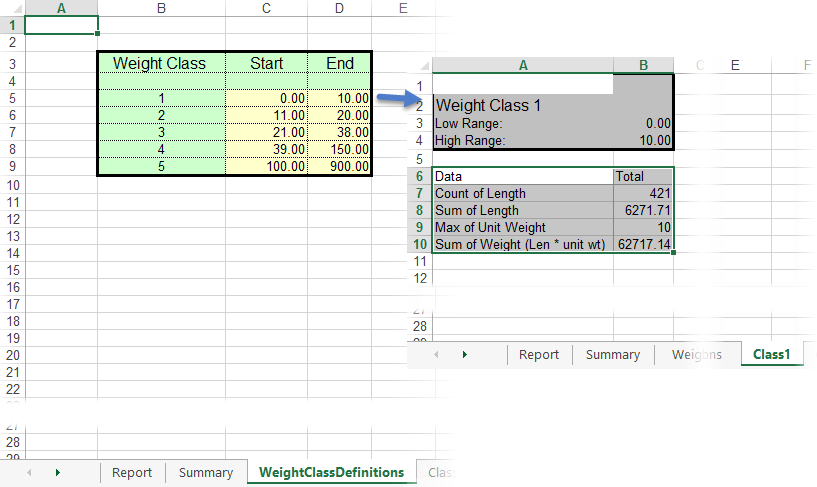
| WeightClassDefinitions sheets | Breaks down your Structural members into weight classes. The goal is to let you know the quantity of lighter members and the quantity of heavier members. Here, you can change the weight class ranges as you need and the calculations will update. Each class has its own sheet following the WeightClassDefinitions sheet (Class1, Class2, Class3 and so on). |
| Overall Center of Mass sheet | Lets you place a point at the overall center of
mass. The center of mass is calculated considering any elements reported on.
Therefore, if a selection set is built prior to generating the report, then the
center of mass will be calculated only from those elements.
Clicking Place a Point at Center of Mass causes a point to be placed at the center of mass as calculated by the report. Just below Place a Point at Center of Mass, the level and line weight at which the point will be placed. If you want the point to be the only graphic on that level, click Delete ALL graphics on Point Level. |