Superelevation Editor
 Used to edit the data in a tabular format.
You can access this tool from the following:

The superelevation editor is another way to edit the data, in a tabular format. Any changes made in the editor are automatically synced with the graphic lanes and vice versa. Any data in gray cannot be edited, due to constraints used during calculations.

The editor is opened by selecting the tool, then selecting the superelevation section(s). The curve sets are listed along the left side. Highlighting any curve set populates the table. Colored points indicate:
Between the diagram and the table are numerous short-cut icons to the superelevation tools.
The superelevation diagram at the top is display only. Right click on the superelevation diagram to display the Superelevation Display List dialog.
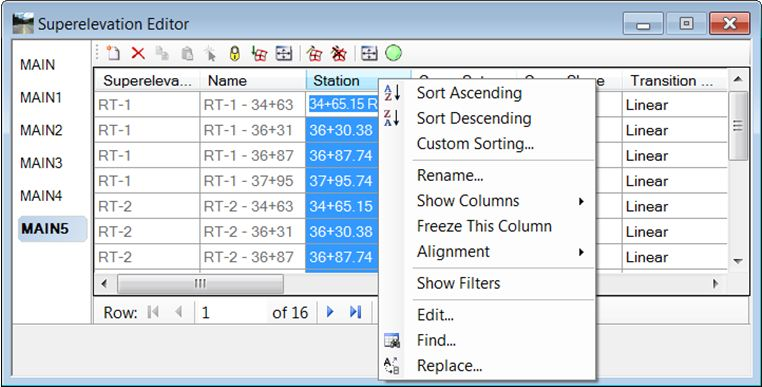
The fields in the editor can be customized so unused or unwanted fields can be hidden. This is accomplished by right-clicking on any header in the tabular data area to open the pop-up menu.