Checking the Status Bar
It is recommended that you make it a habit to frequently check the status bar at the bottom of the application window (or the screen).
It displays a variety of useful information, including prompts, messages, and the name of the selected tool. If you are not sure "where you are" with a tool, look in the status bar.
The status bar is divided into two sections:
Left-hand Section of Status Bar
The far left section ordinarily shows the name of the selected tool (or view control) followed by a greater-than symbol (>) and message text. Message text that follows the ">" is the selected tool's prompt; a tool's prompts guide you step by step as you perform an operation with a tool.
As you move the pointer over tools in a toolbox, the name of the selected tool and the associated message text are replaced with the name of the tool over which the pointer is located. (The name may be abridged.) If the tool is a "representative" of a child toolbox, that toolbox's name is shown as well.
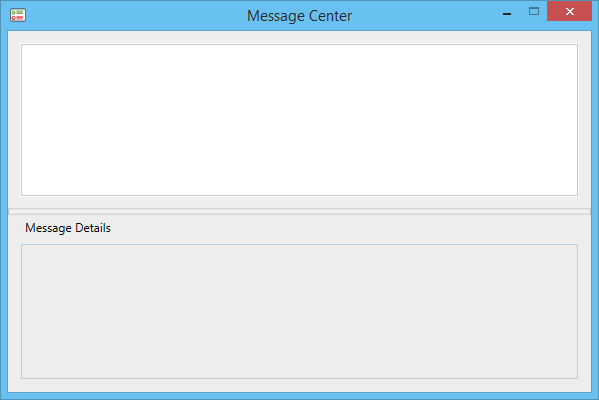
Immediately to the right of the tool section of the status bar is the Message Center window icon and message area, which displays various error, warning, and information messages. For example, if you are using the Copy Element tool and you enter a data point in a blank part of the view instead of selecting an element, the message "No Elements Found" will appear. Clicking the Message Center icon opens the Message Center window, which lets you review the messages that were previously displayed in the status bar.
When you enter a tentative point or request quantitative information — for example, distances or angles using tools in the Measure toolbox — the fields in the section to the right of the Message Center window icon display the values and may be reviewed in the Message Center window.

Right-hand Section of Status Bar
The right-hand section ordinarily consists of a series of fields. From left to right, the status information indicated in these fields is as follows:

- Snap Mode - Clicking this field opens the Snaps ribbon group pop-up.
- Locks - The Locks icon does not indicate status information. Clicking it opens the Locks ribbon group pop-up.
- Active Level - Clicking this field opens the Level Manager dialog.
- Selection Set - The count of selected elements. If this field is blank, no elements are selected.
- Tasks - Shows the name of the current task. (Hidden by default)
- Running Coordinates - Displays the coordinates of your current position. (Hidden by default)
- Fence Mode - If a fence is placed, the icon in this field indicates the fence selection mode. Clicking this icon opens a pop-up menu for adjusting the fence selection mode. If a fence is not placed this field is blank.
- Work Mode - Whether the configuration variable MS_WORKMODE is set to DGN or DWG. When set to DGN, the field is blank. When set to DWG, the field has a white crosshair on a blue background.
- File Changed - Whether changes to the open DGN file are unsaved. If the field is blank, there are no unsaved changes. If the field has a black floppy-disk icon then there are unsaved changes in the DGN. If the field has a red floppy-disk icon with an "X" through it, the open DGN file is open for "read-only" access.
- Design History - Whether the open file has design history and if so, the design history status.
- Dialog with Focus - Indicates the status of the input focus.
- RSS Message Notification - (Icon not displayed in above image) Indicates the RSS Reader has a Critical updated information which is worth your attention.
- Project - Indicates whether the active WorkSet is assigned a ProjectWise Project.
- File Protection - Indicates if the open file is protected and digitally signed.
- Cached Visible Edges Status - Indicates the presence and status of cached visible edge references.