Cumulative Proximity Breach Maps
Cumulative Proximity Breach maps indicate how long mapped areas are above the desired social distancing density, giving a quantitative measure whereby users can qualify their scenario changes
Social distancing density uses a circular density calculation based on social distance radius (SD):
Density = 1 /πx SD2 which gives:
Cumulative Proximity Breach maps are added by default to new and existing LEGION Simulator projects.
The map accumulates each time entity density goes above the density relating to a given social distance. Bluer areas a low risk, yellow-orange areas are riskier, red-pink areas are highest risk. These maps use the Extended Spectral Progression Value Range, where pink represents 15 minutes or higher. An example is shown below;
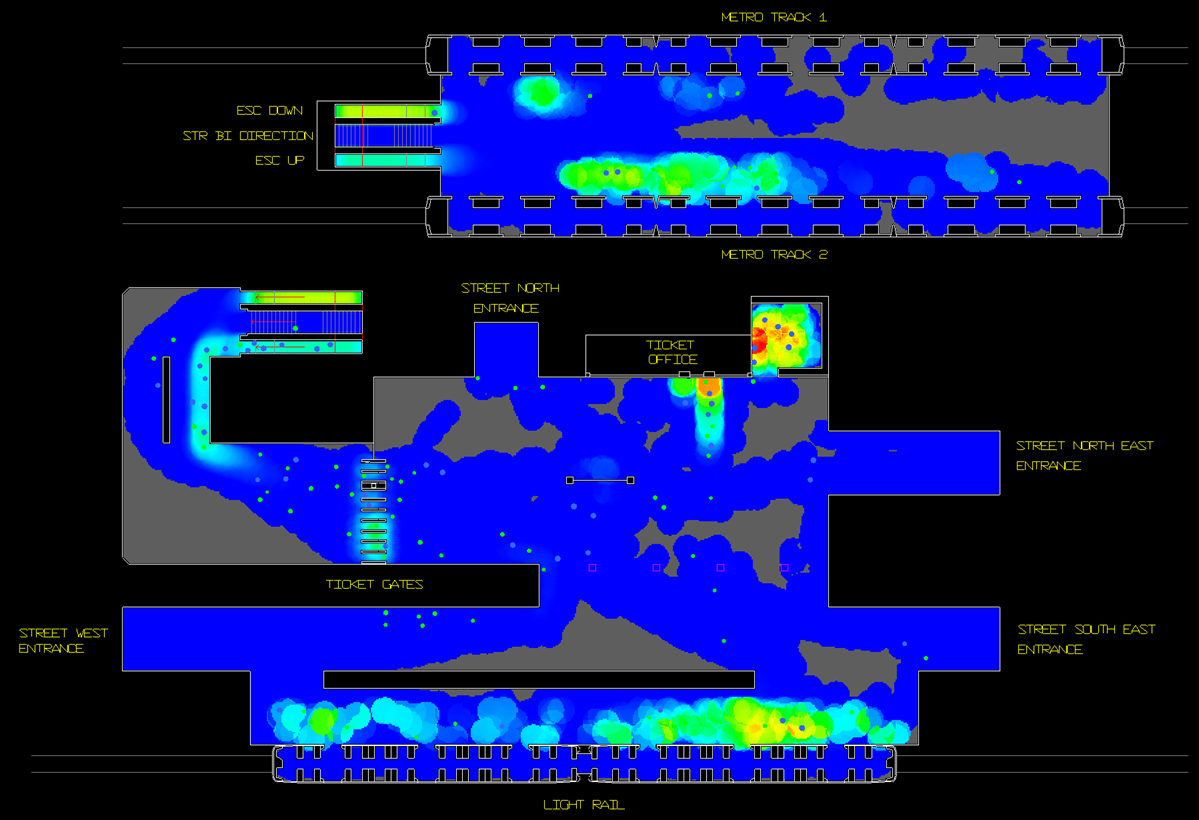
Areas becoming green/yellow/red/pink indicate progressively higher risk.
Maps are found in the Analysis tab of the Object Directory.
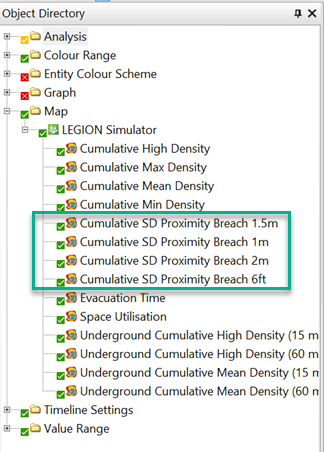
Each map has 4 social distancing variants, covering the anecdotally common separations: