Inspect Results
 After an optimization run
finishes and the user closes the optimization progress window, the Optimizer
Result window opens and displays the results of the optimization run as a
2-dimensional scatter plot of dots.
After an optimization run
finishes and the user closes the optimization progress window, the Optimizer
Result window opens and displays the results of the optimization run as a
2-dimensional scatter plot of dots.
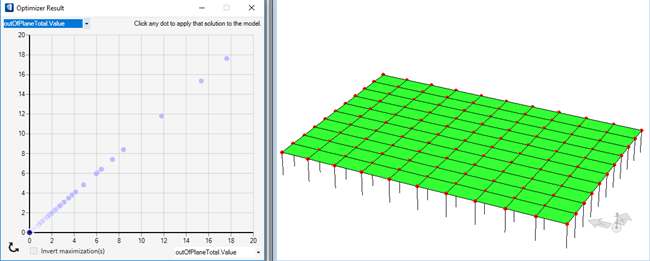
In case of a single objective optimization the window displays the same objective on the two axes, with the scatter plot accordingly a diagonal and the optimum solution closest to the plot's origin.

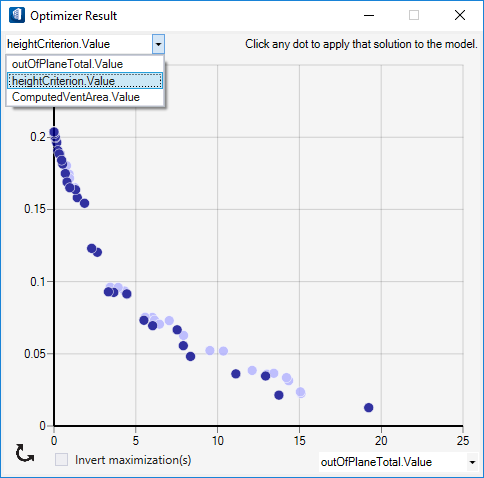
The dark blue dots are non-dominated solutions (see Appendix 1) in the two dimensions of the plot, while the light blue dots are non-dominated solutions under inclusion of the other dimensions of the problem.
For dual- or multi-objective optimization results it is possible to switch which objective is plotted against which axis. This permits users to explore the trade-off that may exist between the various objectives.