New Return Event from Chicago Storm Data
The dialog consists of the following input:
- General Input
- Chicago Storm Input
- Data Format: Choices are Equation (default) and table.
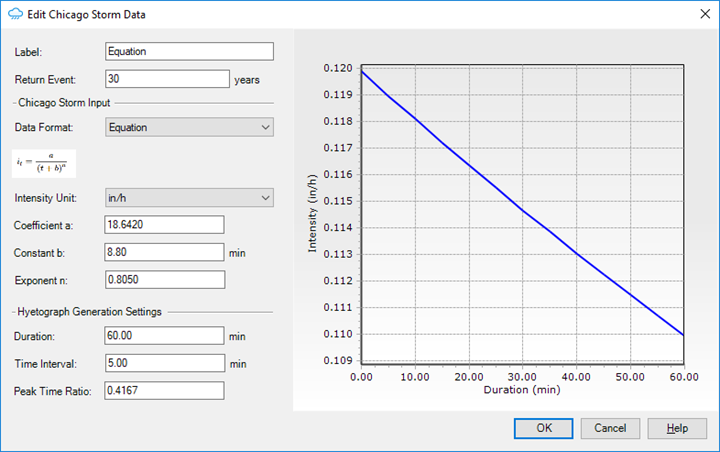
- Equation
- Intensity Unit: The unit that the equation input parameters are based on. The calculation of the intensities is in this unit. The results are converted to inches per hour for storage and then converted to the current display units.
- Coefficient A, Constant B and Exponent C: The parameters for the Chicago storm equation.
- The duration, time interval and peak time ratio are required and used to generate the hyetograph based on the equation data.
- The Sherman I-D Equation is used to calculate the hyetograph.
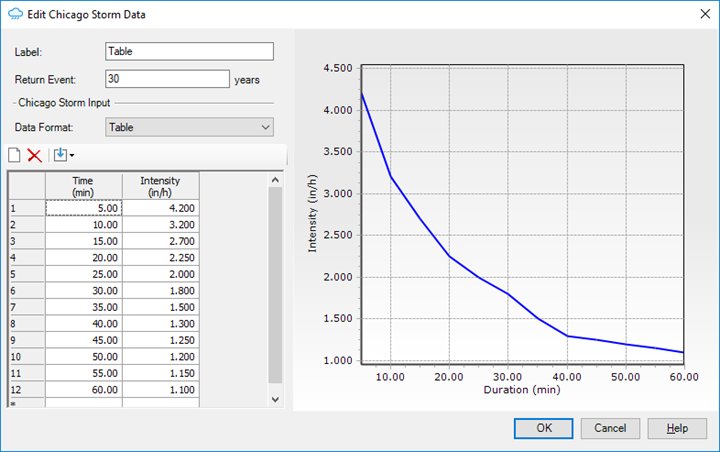
- Table
- Enter in the tabular data as an I-D curve. The data is used to generate a hyetograph.
- The difference between each time value in the I-D curve must be the same.
- A minimum of three points is required.
- The alternating blocks method is used to calculate the hyetograph using I-D table data. See <link> for additional details.
- Import button
- The import drop-down button has two options:
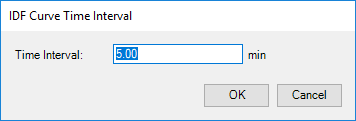
- If the selected IDF table does not have a constant time interval, you are prompted to enter one.
- Quadratic interpolation is used to calculate the intensities for the times started at the first time of the IDF Table to the last time at the specified interval to "normalize" the IDF curve.
- IDF Curve
- Generating the Hyetograph