Critical Storm Analysis
The Critical Storm Analysis feature analyzes the results of the selected scenarios, to determine which scenario is the most critical one either by using the Hydraulic Grade Line at nodes, or the Flow in conduits..
Overview
Results to determine the critical scenario.
It is important to note that the critical storm is unlikely to be the same for every element in the system. At the top of a system, a storm event with a shorter duration is likely to be critical, but working down the system, an event with a longer duration may become critical. If the system includes attenuation, such as a pond, then the critical storm event downstream of it may have a duration of days, as opposed to hours above the pond, or minutes at the top of the system.
Before running Critical Storm Analysis, you need to create and run all the scenarios that you want to evaluate. The analysis is based on time simulations, so scenarios that use the GVF-Rational and GVF-Convex (steady-state) solvers cannot be used. This means that Critical Storm Analysis is not available in StormCAD.
To access the Critical Storm Analysis tool, go to the Compute button on the Analysis ribbon. In the drop-down menu, click Critical Storm Analysis. Choose the Analysis Type, select the scenarios to analyse, and click OK.
Calculation of the Maximum/Mean/Median results
The selected scenarios are processed in a specific order - starting with the shortest return period, and the smallest storm duration within that return period, then progressing up to the longest storm duration within that return period, then moving on to the next smallest return period
Maximum (HGL or Flow)
- Starting at the shortest duration in each return period, find the maximum of the Hydraulic Grade Line (Out) or Flow values.
- Compare the Hydraulic Grade Line (Out) or Flow values found in the other durations and return periods, to see if they are higher.
- The scenario that causes the highest result of all is deemed to be the critical scenario.
If more than one scenario has the same Hydraulic Grade Line (Out) value, then the scenario with the largest volume of overflow is deemed to be the critical one.
Mean and Median (HGL or Flow) results
- For each duration in a return period, find the median or mean from the HGL or Flow values.
- Find the scenario which gives the HGL or Flow that is closest to the median or mean HGL or Flow found in step 1. This is the critical scenario for that duration.
- Repeat steps 1 and 2 for all the durations in that return period.
- Find the highest of the HGL or Flow values identified in step 3. This is the critical scenario for all of the durations in a return period.
- Repeat steps 1 to 4 for all return periods, to identify the critical scenario.
Hydraulic Grade Line at Nodes analysis type
Other node types, such as a Headwall for example, are not considered because they do not have a Hydraulic Grade Line (Out) value. Any inactive nodes for a scenario are ignored.
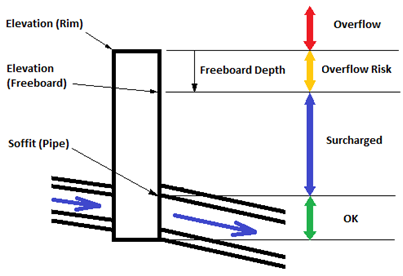
The Critical Storm Analysis determines the worst status for each node over the course of all the scenarios. The status for a node can be one of four values: OK, Surcharged, Overflow Risk, and Overflow.
- If the maximum hydraulic grade is less than the downstream pipe's soffit (inside top of pipe), the status is "OK".
- If the maximum hydraulic grade is greater than the downstream pipe's soffit, but less than the node's rim elevation minus the node's freeboard depth, the status is "Surcharged"
- If the maximum hydraulic grade is greater than the node's rim elevation minus the node's freeboard depth, but less than the rim elevation, the status is "Overflow Risk"
- If the maximum hydraulic grade is greater than the rim elevation, the status is "Overflow"
The scenario with the worst status is shown as the critical scenario for that node.
- If the status for a node is determined as "OK", then the first scenario with that status is shown as the critical scenario.
- The default freeboard depth for the node is 1 foot (304.8 mm).
- The soffit is determined by adding the Rise (Unified) of the downstream pipe to its upstream invert. If the downstream pipe is set to use the invert of the upstream node, the invert will be the node's invert elevation. The information is used for the scenario being analyzed from its assigned physical alternative.
Flow in Conduits analysis type
This analysis type uses conduits to calculate the critical scenario. All types of conduit - closed sections, open sections, and culverts - are included. Any inactive conduits for a scenario are ignored.
The critical scenario is determined by analysing the Flow values, as described above. The status of each conduit is not directly related to the flow - the flow determines the critical scenario, and the status provides an indication of how the conduit is operating.
- If the HGL (In) is less than the Soffit (Start) and the HGL (Out) is less than the Soffit (Stop), the status is "OK"
- If the HGL (In) is greater than the Soffit (Start), but less than the Conduit Freeboard (Start), and the HGL (Out) is greater than the Soffit (Stop), but less than the Conduit Freeboard (Stop), the status is "Surcharged"
- If the HGL (In) is greater than the Conduit Freeboard (Start), but less than the Elevation Ground (Start) and the HGL (Out) is greater than the Conduit Freeboard (Stop), but less than the Elevation Ground (Stop), the status is "Overflow Risk"
- If the HGL (In) is greater than the Elevation Ground (Start) and the HGL (Out) is greater than the Elevation Ground (Stop), the status is "Overflow"

- The soffit start and stop elevations are calculated by adding the Rise of the conduit to the start and stop invert elevations.
- The Conduit Freeboard elevations are calculated by deducting the Conduit Freeboard value, which is set in Options, from the Ground Elevation. The Freeboard values from the connected nodes are not used, because not all node types have it.
- If the status at one end of the conduit is different to the other, then the higher status is used. For example, if the status at the start is Surcharged, and at the stop is Overflow Risk, then Overflow Risk is used.