Scenario Comparison
The scenario comparison tool enables you to compare input values between any two scenarios to identify differences quickly.
The scenario comparison tool can be started by selecting the Scenario Comparison icon in Analysis > Calculation >Scenarios split button.
If the button is not visible, it can be added by right-clicking and selecting Scenario Comparison from the menu.
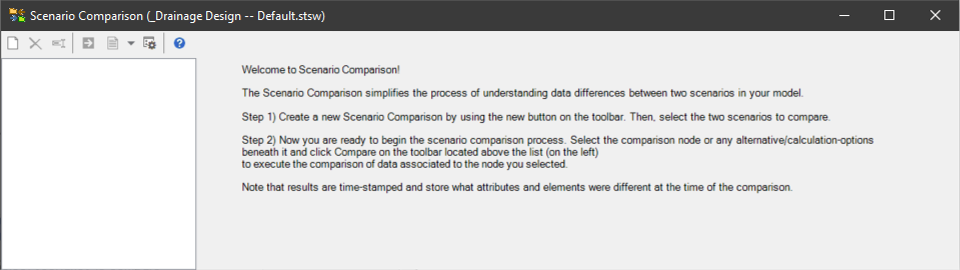
On first opening the scenario comparison tool, the dialog below opens which gives an overview of the steps involved in using the tool. Pick the New button (leftmost).
This opens a dialog which allows you to select which two scenarios will be compared.

The scenario manager button next to each selection gives you the ability to see the tree view of scenarios. Chose OK to begin the scenario comparison tool. This initially displays a list of alternatives and calculation options, with the ones with identical properties displayed with a yellow background and those with different properties displayed with a pink background. The background color can be changed from pink to any other color by selecting the sixth button from the left and then selecting the desired color.
The dialog below shows that the Active Topology, Physical, Demand and Constituent alternatives are different between the scenarios. There is a second tab for Calculation Options which shows if the calculation options are different between scenarios.

This display can also be copied to the clipboard using the Copy button.
The alternatives that have differences are also shown in the left pane with a red mark as opposed to the green check indicating that there are no differences.

To obtain more detailed information on differences, highlight one of the alternatives and select the green and white Compute arrow at the top of pane (fourth button).
This initially returns a summary of the comparison which indicates the time when the comparison was run, which scenarios were involved and number of elements and attributes for which there were differences.

By picking "Differences" in the left pane for the alternative of interest, you can view the differences. In this display, only the elements and properties that are different are shown with a pink background. In the example below, only 7 pipes had their diameters changed and only 3 of those had difference C-factors. There are separate tables for each element type that had differences.

Using the buttons on top of the right pane, when Differences is selected, you can create a selection set of the elements with differences or highlight those elements in the drawing. This is very useful for finding elements with differences in a large model.