Graph
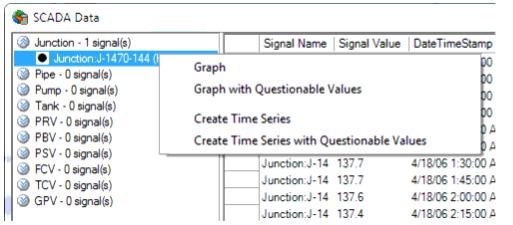
To view a graph of any mapped signal follow the steps described below. However, to learn more about graphing, see Graphs’.
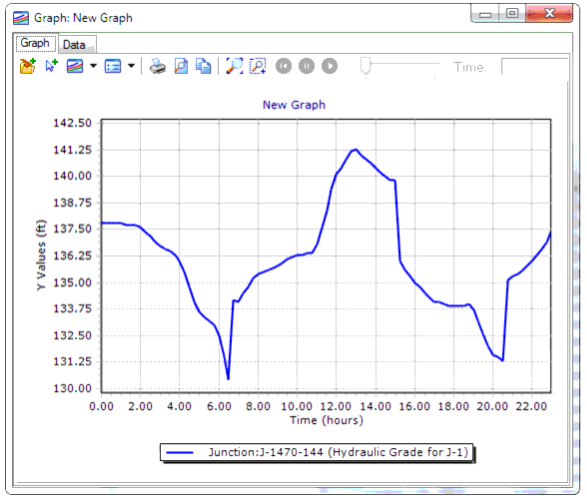
Since the graph is displayed on Standard User Interface of the hydraulic model, native command of graph window can be utilized.
For example, if a pressure SCADA data are viewed in graph, then from Add to Graph button of the Graph you can add any desired element from a Drainage and Utilities EPS run and compare the data directly.
Note: If SCADA data contains Questionable value = TRUE, then such data will be discarded and not be displayed in the Graph.
- Graph with Questionable Values: When this option is selected, the SCADAConnect will not filter any data on Questionable field (or column) and will display all the attributes in the graph.
- Create Time Series: To create Time Series Field Data’ using the SCADA Data, right click on any mapped signal in the SCADA Data window and select Create Time Series.
- A message box confirming the creation of the Time Series Field Data will be displayed. To check the newly exported data go to Components > Time Series Field Data.
- Create Time Series with Questionable Values: When this option is selected, the SCADAConnect will not filter any data on Questionable field (or column) and will export all the attributes in the Time Series Field Data.