| Preview |
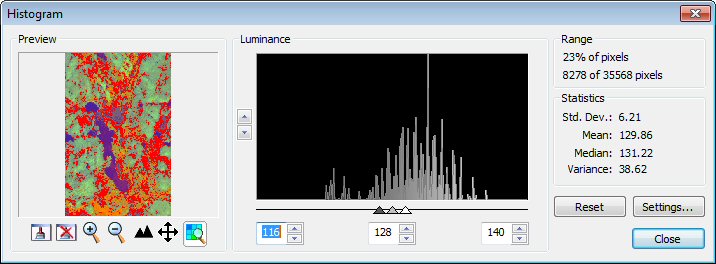
The Preview pane provides visual feedback on the selected image by applying a highlight to all pixels included in the range. A set of controls allow you to explore the preview (Zoom In, Zoom Out, Pan, Fit, Update Preview, Update View and Restore View).
|
| Luminance |
The Histogram dialog is used to track and analyze data based on a specified range of values. These values are represented graphically using the Histogram representation. The Sliders are used to comprise in that range on the required values. All the pixels (values) comprised in that range are highlighted on the image.
The Histogram graph is displayed using the Luminance algorithm which is required for histogram exploration and exact data distribution figures.
The Up/Down controls at the left of the graph are used to adjust the Vertical Scale of the histogram. The Sliders and text boxes are used to position the start and end points of the range. The Center Slider is used to move the ranger across the histogram.
|
| Range |
The Range group box displays the content of the clipping range, pixels comprised between the shadows and the highlights sliders. The first line displays the number of pixels comprised in the clipping range. The amount is expressed in percentage. The second line displays the amount of pixels comprised in the range and the total amount of pixels comprised in the histogram.
|
| Statistics |
The Statistics group box displays statistical information about the pixels comprised in the range.
-
Standard Deviation
-
Mean
-
Median
-
Variance
|
| Reset |
The Reset button resets to default values all dialog settings.
|
| Settings |
Selecting this option opens the Histogram tab in the Descartes Settings dialog box allowing you to set the Hilite Color.
|
| Close |
Click Close to close the Histogram Display dialog box.
|