Quality Metrics
The Quality Metrics allows a quick 3D analysis of aerotriangulation result. A variety of metrics are proposed, ranging from scene coverage to position uncertainty for photos and survey points.
Access the metrics by clicking on the "Quality Metrics" button:

Subsequently, click on the metric thumbnail to access the entire list of metrics.
Click on the metric thumbnail to access the entire list of metrics.
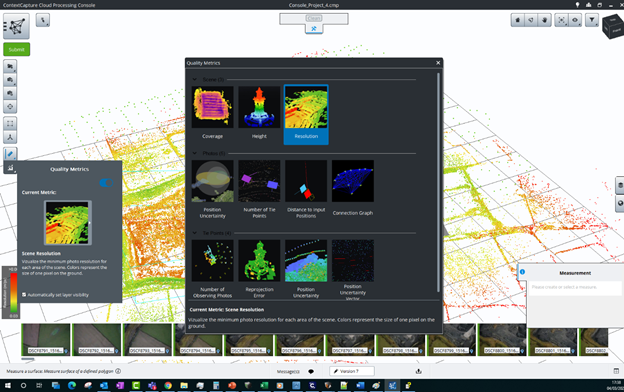
The Quality Metrics dialog, with the current metric and the list of all available metrics.
Proposed metrics:
- Scene
- Coverage: indicates the number of photos that potentially see each area. Note: occlusions are ignored, points that are hidden by other parts of the scene are considered as visible if they are in the field of view of the photo.
- Height: colors the generated tie points according to their vertical position.
- Resolution: displays the ground resolution (in 3D units/px) for each generated tie point.
- Surveys
- Position uncertainty: exposes a visual representation of how certain are the image positions of each survey point. Transparent spheres around the survey points indicate how uncertain is the position (scaled for readability). Colored ellipses show the most uncertain direction and its magnitude. Note: only available if surveys are present in the scene.
- Control point distribution: indicates how far from a control point are the generated tie points. To calculate this distance, we consider the photos and the link between photos. Note: only available if control points are present in the scene.
- Photos
- Position uncertainty: illustrates to what point the ContextCapture optimization is certain of the estimated photo positions. Transparent spheres around photos indicate the position uncertainty (scaled for readability). Colored ellipses show the most uncertain direction and its magnitude.
- Number of tie points: colors the photos according to the number of tie points linked to them.
- Distance to input positions: shows the offset between the input positions and the computed photo positions. Colors indicate the magnitude, and lines indicate the direction of the change in position. Note: only available if input positions are provided.
- Distance to input rotations: illustrates the difference between the input rotations and the computed photo rotations. Colors indicate the angle difference. Note: only available if input rotations are provided.
- Connection graph: displays links between photos; two photos are paired together if they have tie points in common.
- Tie Points
- Number of observing photos: represents the number of photos that have been used to define each point, smoothed over the set of photos seeing the point. The average mean value is used in order to provide a comprehensive information about the scene and filter noisy data.
- Reprojection error: considers the pixel reprojection error for each tie point.
- Position uncertainty: indicates the individual tie point position uncertainty, averaged over the photos seeing the point. This metric illustrates how well placed can we expect the generated tie point to be after the ContextCapture optimization.