Statistics Table Dialog Box
This dialog displays calculated statistics for a water quality batch run.
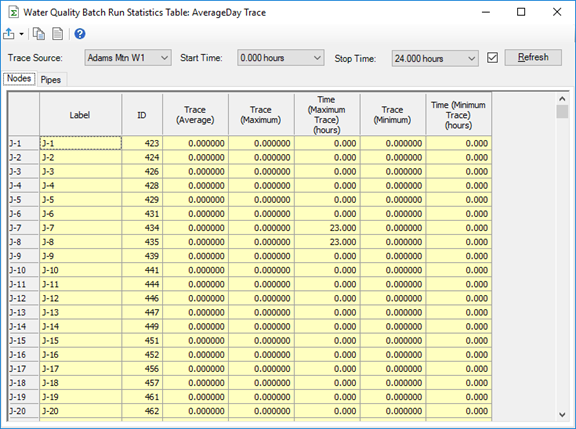
The dialog shows the statistics in a tabular format divided into a Nodes tab and a Pipes tab, along with the following controls:
- Export: The default behavior
is Export to Excel. When the drop-down arrow is clicked, a menu with two
options is displayed:
- Export to Excel: Exports the statistics table for all trace sources at the specified start time and stop time. Each source is created as its own worksheet in a single workbook. Only the data for the current tab is exported (i.e. if "Nodes" is selected then only nodes are exported. If "Pipes" is selected, then only pipes are exported).
- Export for Color Coding: Opens the Export for Color Coding dialog, allowing you to specify the scenario and fields to export for use with the color coding feature.
- Copy: Copies the statistic table to the clipboard for use in an external application.
- Report: Generates a preformatted report containing the data in the statistics table.
- Help: Opens the online help.
- Alternative/Trace Node: For Trace Analysis, this field allows you to select the Trace Node for which statistics are calculated. For Constituent Analysis, this field allows you to select the constituent scenario.
- Start Time: Allows you to select the start time for the statistics calculations.
- Stop Time: Allows you to select the stop time for the statistics calculations.
- Auto-Refresh: When this box is checked, the results in the table will automatically be refreshed when changes are made.
- Refresh: Refreshes the results displayed in the table to reflect changes made in this dialog.