Energy Cost Results
After a successful energy cost calculation, the following summary table is presented:

- Energy - total energy used during EPS scenario (in all calculations turbine energy generation appears as a negative value).
- Energy Cost - the total cost of energy during the scenario.
- Storage Cost - the net cost of energy in water entered or removed from storage.
- Daily Cost - the total energy cost divided by the duration of the scenario in days.
- Volume - the total volume of water that passes through pumps or turbines during a scenario.
- Unit Energy Use - the energy required to pump a given volume of water (also known as specific pumping energy).
- Unit Energy Cost - the cost of energy required to pump a given volume of water.
- Peak Demand Cost - the cost for power used during the peak time step during the scenario.
- Carbon Emission - the total carbon emission during the scenario.
- Run Duration - the duration of the Energy Cost Scenario.
After a successful energy cost calculation, the following results summaries appear in the tree view:
Pump/Tubine Usage
The most important results in the Pump Usage summary are Total Energy Use Cost and Average Efficiency, either pump or wire-to-water.

There are tabs for Pumps, Variable Speed Pump Batteries, and Turbines showing summary results for each pump, VSPB, and turbine included in the scenario energy cost calculation.
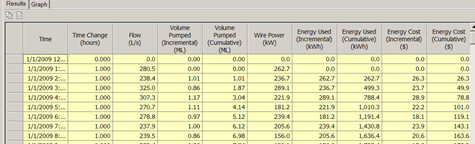
Pump Time Details
The Pump Time Details summary gives the energy usage study summed up over all the selected elements. These results can also be copied to the clipboard or displayed in a report using the Copy and Report buttons above the table.
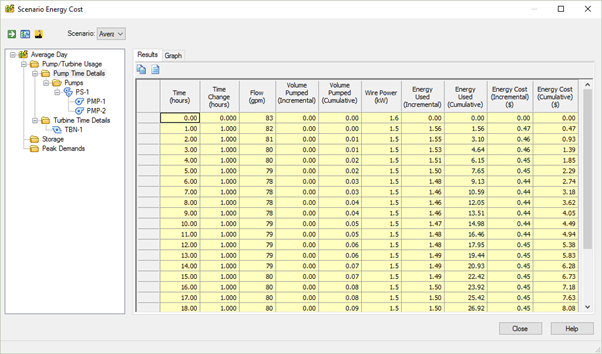
Some values in the table are instantaneous values at that time and others are incremental values from that time to the next time. For example:
The value of 1309 for discharge is the instantaneous value at time 0, while the incremental volume pumped is the volume pump from the previous time step until time equals 0. At time 3, the instantaneous value for flow is 1343 gpm but the value for Incremental volume pumped is the volume pumped between times 2 and 3, which is (1341*60/106)=0.08. Incremental values at time t(i) are the value between t(i-1) and t(i). Attributes such as wire power, efficiency, and cumulative energy used are instantaneous values corresponding to t(i).
You can also view the results in graph form by clicking on the Graph tab.
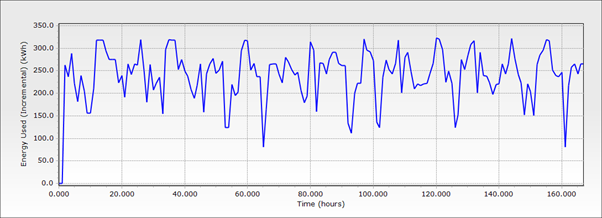
You can copy the graph to the clipboard for use in other software and you can open the Graph Editor to change the appearance of the graph. (See Tee Chart editor for more information.)
If you change the default settings for the Graph Manager, they are applied to all graphs as long as you remain in the Energy Cost Manager. Once you close the energy cost manager, the graph manager goes back to the default settings.
Pump Results
Below Time Details icon is a Pumps folder containing an icon for each individual pump. Clicking one of these pump icons will display results for that pump. It includes the information that is in the time details report, except it only includes results for one pump at a time. An additional column is shown for pump speed.

You can also view the results in graph form by clicking on the Graph tab.
You can copy the graph to the clipboard for use in other software and you can open the Graph Editor to change the appearance of the graph. (See Tee Chart editor for more information.)
If you change the default settings for the Graph manager, they are applied to all graphs as long as you remain in the Energy Cost manager. Once you close the Energy Cost manager, the Graph manager goes back to the default settings.
If the model contains variable speed pump batteries below the Pump Time Details icon another folder VSPBs is shown with results similar to the Pump Results.
For models with turbines below the folder Pump/Turbine Usage an additional folder Turbine Time Details with the summary results for all turbines is shown.

Similar to the Pump Time Details these result values can be graphed, displayed in a report or copied to the clipboard.
Below this folder for every turbine the detailed energy calculation results are shown.

Storage
The values displayed in the storage table show the value of energy that is used by draining water from a tank or gained by storing water in a tank.

These results can also be copied to the clipboard or displayed in a report using the Copy and Report buttons above the table.
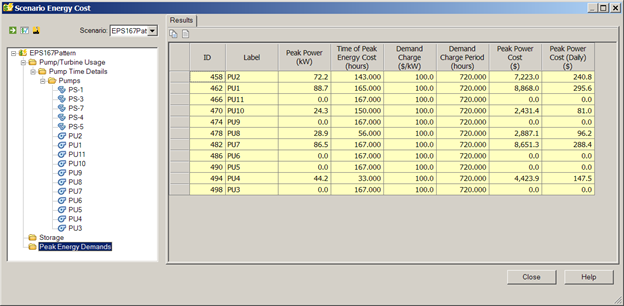
Peak Demands
The results in the Peak Demands table are used to determine the cost for capacity/demand/peaking charges that are based on peak energy use. These costs are usually applied to the energy cost as a lump sum each billing period. The table also divides the cost by the length of the billing period to determine the daily cost so that it can be added to the energy costs. Peak demand charges are usually set on a peak water use day or a day with a special event, such as a fire or large main break. Demand charges are not set on an average day.
These results can also be copied to the clipboard or displayed in a resort using the Copy and Report buttons above the table.