I-D-F Curves
Note: The rainfall intensities that are used with the Rational method are generally determined by regulatory agencies. Historical rainfall information is analyzed and compiled into I-D-F curves based on the frequency of the storm data. These curves give the engineer a quick reference to determine the intensity of rainfall that occurs at given return periods.
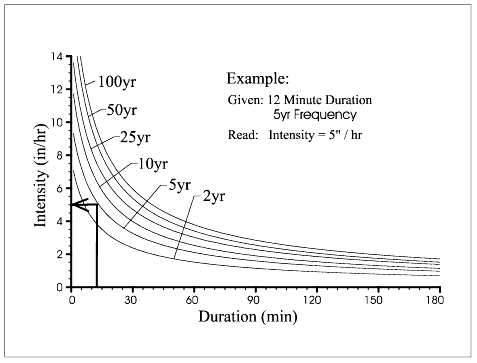
I-D-F (Intensity-Duration-Frequency) curves provide the engineer with a way of determining the rainfall intensity for a given storm frequency and duration.
Reading an I-D-F Curve
For example, a 5-year frequency, the resulting average intensity is 5 inches an hour for 12 minutes. In other words, if an average intensity of 5 inches/hour falls for a period lasting 12 minutes, it would be considered a 5-year event.