Hydraulic Reviewer Tool
This version of Bentley SewerGEMS includes a hydraulic reviewer tool to quickly assess the convergence and stability of the model. To begin using the tool click Analysis > Analysis Tools > More... > Hydraulic Reviewer.
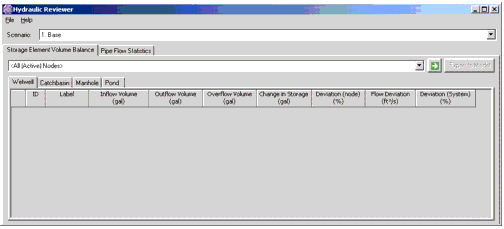
This opens a dialog which initially looks like this.
The user first selects the name of the scenario for which the hydraulic reviewer will be performed using a drop down list of scenarios. The calculation of the scenario must already have been run and the output file should not have been deleted.
Once the scenario has been selected, the user chooses between two tabs
Storage Element Volume Balance
The Storage Element Volume Balance tab determines the overall balance of flows at any node which can have storage which can include
The user can also use a drop down list of any previously created selection set of node elements on which to perform the review. The default is All Active Nodes.
Picking the green Go arrow starts the calculation which for each node determines the inflow, outflow and overflow volumes over the course of the runs and the percent deviation from perfect flow balance as
Flow Deviation (node) = 100% (In - out - over - change in storage)/Duration
Deviation (node) = 100% (In - out - over - change in storage)/In
Deviation (system) = 100% (In - out - over - change in storage)/Total System Inflow
The results are presented in decreasing order based on Error. Any column can be sorted, filtered or have the display format changed as with any other flex table.
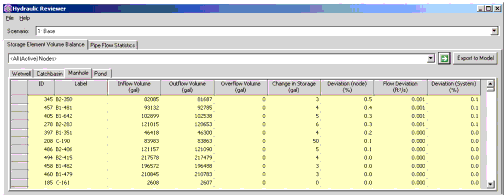
On some occasions the Deviation (node) may appear large but this is primarily due to the inflow volume being very small. Users may want to discount the importance of any errors at nodes where the inflow rates (and deviations) are on the order of 0.1 cfs or less.
Pipe Flow Statistics
The Pipe flow statistics tab provides an indication of the change of flow rates from one time step to the next.
To use this tab, the user can chose All Pipes (the default) or any selection set of pipes. The calculation is run by picking the green Go arrow. It will display a table like the one below, sorted in order of decreasing Maximum Deviation.
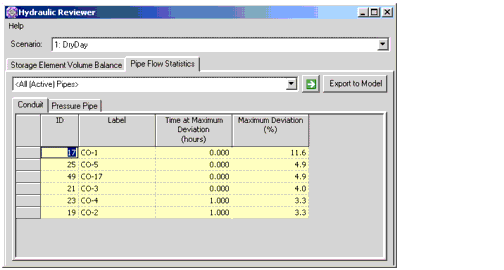
High values for Maximum Deviation do not necessarily indicate that the model contains errors or is unstable. Some pipe links have very large changes in flow from one time step to another such as in the case of a pump cycling on an off. In some cases, numerical models can overshoot the calculated flow when the flow rate changes abruptly. This effect usually dies out after one or two time steps. Nevertheless, the Maximum Deviation can serve as an indicator of locations with possible stability issues.
Once the calculations have been performed, the user can export the values to a previously created User Defined Property so that the values can be used in color coding, flex tables, etc. Click on Export to Model to reach the dialog below and select Export to actually export the numerical values.
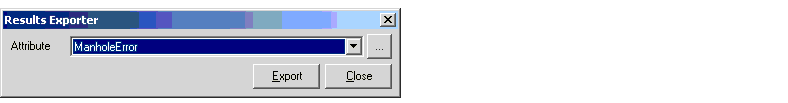
If the user defined property doesn't exist, the user can create one by picking the ellipse button and following the instructions for user data extensions. Note that the user defined property the data will be exported to must use the following settings
Data Type: Real
Dimension: Percent
Storage Unit: Percent