2D Grid Browser
The Grid Browser provides the ability to review gridded input parameters and computed results with the 2D computational grid.
To open the Grid Browser, go to the [2D Modeling] ribbon tab and click on Grid Browser in the 2D Analysis section.
An active grid and terrain model are both required to use the Grid Browser. The terrain model provides the surface elevation values of computational grid, prerequisite to computing a coupled 2D hydraulic model.
Once open, click the Refresh Grid to update an existing, or create a computational grid for the first time. You can also generate the grid before opening the Grid Browser by clicking the Generate Grid button to the left of Grid Browser in the ribbon.
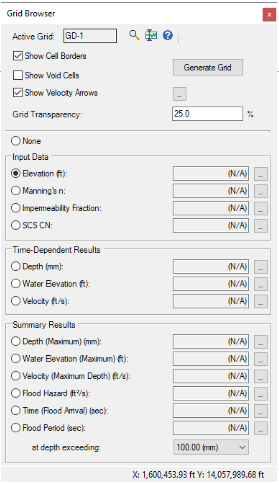
- Show Cell Borders – regardless of the selected layer, you can optionally show the borders of the cells in the grid.
- Show Void Cells – regardless of the selected layer, you can optionally show the void cells in the grid. These are grid cells that have no data like those area where there is a void area or void point.
- Show Velocity Arrows – applies to input and time-dependent result layers. Shows the velocity arrows for each non-void cell in the grid if 2D velocity results are available for the scenario.
- Grid Transparency – determines the transparency of the grid cells. The default is 0% but a value of 50% is recommended.
Layers
- None – the default selected layer when the grid browser is opened for the first time for a scenario. While None, no tooltip is available when the cursor is over any part of the grid. Also, no color will be applied to the grid or grid cells.
Input Data
- Elevation – the elevation at the center of the corresponding grid cell where the mouse is located. Any adjustments have already been applied.
- Manning’s n – the Manning’s n value applied to the entire grid cell where the mouse is located. Any adjustments have already been applied.
- Impermeability Fraction – the impermeability fraction at the grid cell where the mouse is located. Any adjustments have already been applied.
- SCS CN – The SCS CN (curve number) at the grid cell where the mouse is located. Any adjustments have already been applied.
Time-Dependent Results
Results from a successful 2D Solver run are required to activate the results layers of the Grid Browser. These gridded values of Time-Dependent Results vary with the prescribed time interval declared with the calculation option Grid Output Increment.
- Depth – The ponding depth of water atop the grid cell where the mouse is located for the current time step.
- Water Elevation – The ground elevation at the grid cell plus the depth at the grid cell where the mouse is located at the current time step.
- Velocity – The velocity of the water at the grid cell where the mouse is located for the current time step.
Summary Results
- Depth (Maximum) – the largest depth over a grid cell over the duration of the simulation.
- Water Elevation (Maximum) – the largest water surface elevation computed for a grid cell over the entirety of the simulation.
- Velocity (Maximum Depth) – the velocity of the water column on the corresponding grid cell, computed at the time of its maximum depth.
- Flood Hazard – is derived for each grid cell using the maximum depth and its corresponding velocity at maximum depth.
- Time (Flood Arrival) – the time elapsed since the start of the simulation at which the depth first exceeding the value of the calculation option Minimum Flood Arrival Depth.
- Flood Period – is the cumulative simulation time that each grid cell has a ponding depth that exceeds the currently selected Flood Period Depth. The available choices of Depth are based on the calculation option values supplied for Flood Period Depths when 2D results were computed. For Flood Period results to be available in the Grid Browser, you must enable the calculation option Output Flood Period Details before a calculation run with the 2D Solver.
As the mouse moves over the grid, a tooltip is displayed showing formatted numerical value for the current layer, including the display unit. If the mouse moves over a voided cell, then (N/A) will be shown in the tooltip.
Toolbar Buttons
- Zoom – the zoom button will zoom to the active grid. Zooms to the active grid in the model and centers it in the drawing.
- Time Browser – this will open the time browser docking window so the time step can easily be changed.Opens the time browser docking window to change the current time step and update the grid in the drawing.
- Help – opens this help topic.